
How to translate these numbers to the aquarium?
This is a good question. At first we thought that we could transport these values to the aquarium tout-court. Then we filled the aquarium, inserted the probe, and redid the measurements. Basically, while at 20 cm the result is practically the same, but as we progressed, thanks to the glass reflecting the light and the water, we found values bigger than the values measured in air. Obviously this isn’t a detail that can be standardized, so we think that our method of calculation is the most correct, and the best for the comparison of different ceiling lights.
Consumption
The measurement of the consumption was made possible thanks to the useful device RCE PM600 that can also measure the Cos(fi) (or power factor). The result is given in watts. 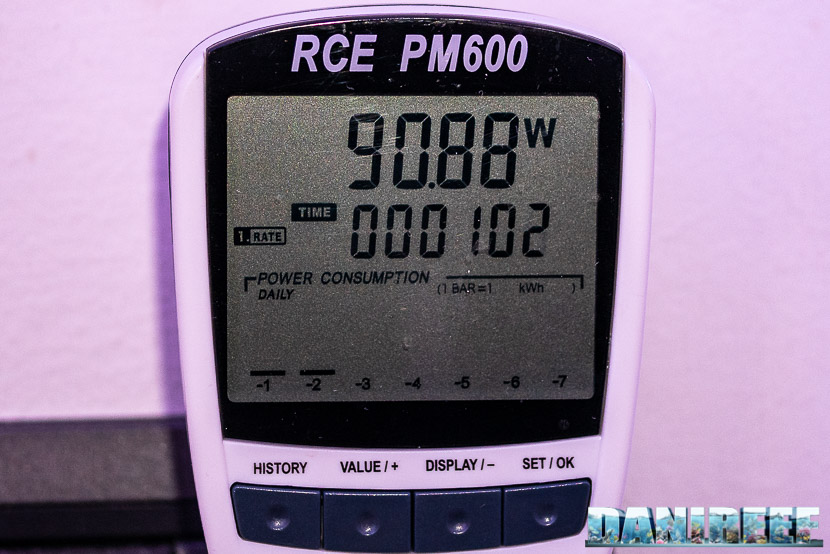
The calculus of the absorbed current, which is the power, is as follows:
Ceiling light Aqamai LRM: 90.88 watt. Considering that at 17 cm the ceiling light has at the middle 2,285 μmol m-2 s-1, we can estimate that it will have a peak value of 25.14 μmol m-2 s-1 w-1 (PAR per watt). A higher value than Philips CoralCare, due to the choice of distribution.
The value is lower than the declared one of 100 w. Maybe it depends also on the fan rotation speed.
The comparison with other ceiling lights on the market
Recently we started to use the new Apogee’s Quantum Meter MQ-510. For this we can’t completely compare the data of other ceiling lights because before we used the probe Seneye. The Aqamai LRM is the second ceiling light with which we adopt this method, so there will come many more comparisons in the next weeks. Actually, we’ve already measured the values of the Cetus 2 and the Aqamai LRS.
But considering these two first-tested ceiling lights we can do an interesting comparison anyway.
| Energy | Price | Consumption | Energy/€ | Energy/w | |
| Aqamai LRM at 17 cm | 642,649 | 465 | 90.88 | 1,382 | 7,071 |
| Aqamai LRM at 37 cm | 721,676 | 465 | 90.88 | 1,552 | 7,941 |
| Aqamai LRM at 57 cm | 616,470 | 465 | 90.88 | 1,326 | 6,783 |
| Philips CoralCare at 17 cm | 1,858,572 | 749 | 190.50 | 2,481 | 9,756 |
| Philips CoralCare at 37 cm | 1,340,533 | 749 | 190.50 | 1,790 | 7,037 |
| Philips CoralCare at 57 cm | 933,246 | 749 | 190.50 | 1,246 | 4,899 |
 The energy produced per watt is more constant in the Aqamai LRM than in the Philips. Same for the energy per watt when we progressively move away from the release point: it’s better with the Aqamai than the Philips; having the LEDs on the external surface means more loss on the sides. At 37 cm the values are pretty comparable, but we have to remember that the Philips has twice the costs and consumption, and therefore higher values.
| Ceiling light | PAR | Watt | Price | PAR/watt | euro per watt |
| GNC 466 | 696 (Seneye) | 120 | 1,400 euro | 5.8 spread | 11.7 |
| Orphek Atlantik V4 | 1,515 (Apogee) | 226 | 1,099 euro | 6.7 spread | 4.9 |
| Philips CoralCare 2019 | 2,088 (Apogee) | 190 | 749 euro | 11 spread | 3.9 |
| Maxspect Ethereal | 689 (Seneye) | 130 | 500 euro | 5.3 semi-spread | 3.8 |
| Led Bars Askoll Pure Marine | 237 (Apogee) | 28 | n.d. | 8.4 | |
| Zetlight UFO ZE-8000 | 791 (Seneye) | 91.5 | 500 euro | 8.6 cluster | 5,5 |
| Aqamai LRM | 2,285 (Apogee) | 90.88 | 465 euro | 25.14 double cluster | 5.1 |
 The Aqamai LRM has the highest value of peak PAR per watt we’ve ever measured. The euro per watt values are average.
Mantainence costs
The Aqamai LRM ceiling lights costs 465 euro ($515 USD).
The absorbed power is 90.88 watt, so the relationship cost/watt is about 5.1 euro per watt. In order to do a comparison with the other ceiling lights you can refer to this chart:
| Ceiling light | Price | Consumption | Relationship euro per watt | |
| Philips Coralcare 2019 | 749 euro | 190 watt | 3.9 euro per watt | |
| Maxspect Ethereal | 500 euro | 126 watt | 4.0 euro per watt | |
| radion XR30w G2 PRO | 790 euro | 170 watt | 4.7 euro per watt | |
| radion XR30w G4 PRO | 915 euro | 190 watt | 4.8 euro per watt | |
| OceanLed Sunrise 600 | 870 euro | 180 watt | 4.8 euro per watt | |
| Orphek Atlantik V4 | 1099 euro | 226 watt | 4.9 euro per watt | |
| radion XR30w G2 | 690 euro | 140 watt | 4.9 euro per watt | |
| radion XR30w G4 | 760 euro | 150 watt | 5.1 euro per watt | |
| Aqamai LRM | 465 euro | 87.5 watt | 5.1 euro per watt | |
| Zetlight UFO ZE-8000 | 500 euro | 91.5 watt | 5.5 euro per watt | |
| CEAB Slide & Led | 2,700 euro | 275 watt | 9.8 euro per watt | |
| sicce GNC 466 | 1,592 euro | 120 watt | 13.3 euro per watt |
The ceiling light is very well built and easy to set up, especially if you use the preset programs. The PAR are very good especially in the middle and in terms of efficiency are perfect. Sure, they can’t compete with ceiling lights that consume twice as much, even if they have a perfect performance for their consumption. Perfect for demanding corals probably in an area of 30×30 cm. It has an average cost per watt relationship and a record peak PAR per watt. What else we can ask for?
Questions and comments, as always, are welcomed. And most of all, do you like our measuring method? [Translated by Agnese Poggi]
 After two years, we finally have the opportunity to test a new sample of the LED Aqamai LRM ceiling light, which has been designed to compete with the top lights on the market. We’re going to submit it to our test in the DaniReef LAB.
The ceiling light is very similar to the one we tested back in September 2017 (our article), and it was great, but after two years the LEDs have gotten a big update, with better efficiency and power. And what has changed for us is that we now have a professional system called DaniReef LAB, that uses the ultra professional probe Apogee Quantum Meter MQ-510.
Technical Characteristics of the Aqamai LRM
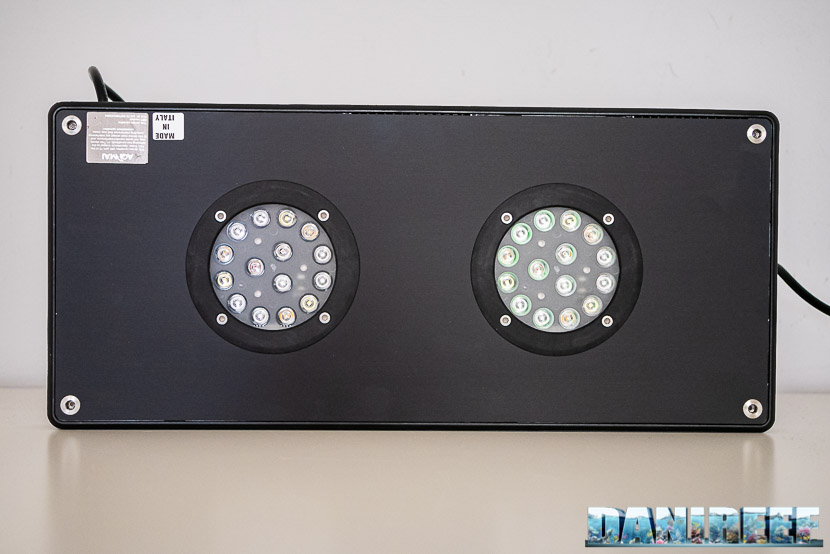
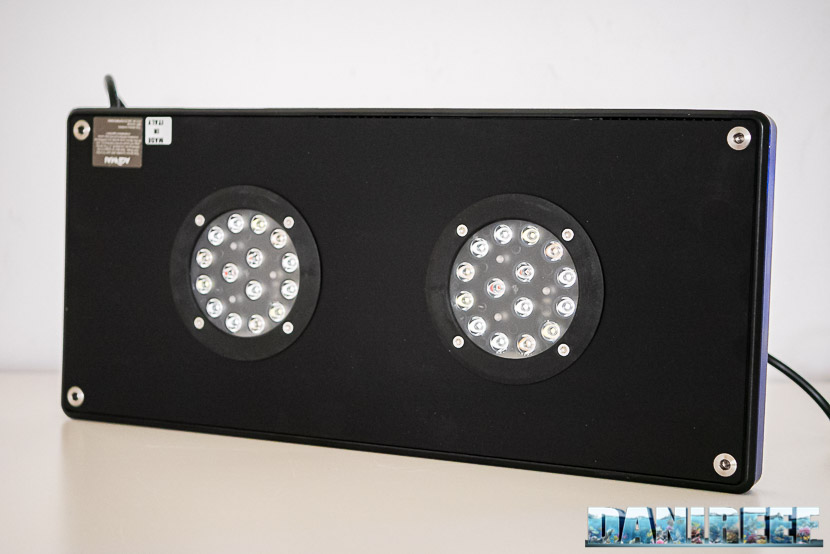
The LEDs are 8 different colorations and they are divided into 6 channels. There are 15 LEDs for each cluster. The “cool whites” are pretty interesting: 6 Nichia NVSW219C of CRI > 70 and 180 lumen/watt, a very high value.
Other LEDs complete the selection: a couple of UV LEDs by SemiLEDs of 405 nm, 4 Indigo by SemiLEDs of 415 nm, 6 Royal Blue by Nichia NCSC219BT (very beautiful, I have to say), 6 Blue NichiaNCSB219BT, 2 Green Nichia NCSG219BT, 2 Red-A Nichia NCSR219BT and finally 2 Red-B OSRAM Oslon SSL.
- Power: 100 w
- Dimensions: 36x16x2(h) cm
- Selling price: 465 euro including VAT ($515 USD)
Construction
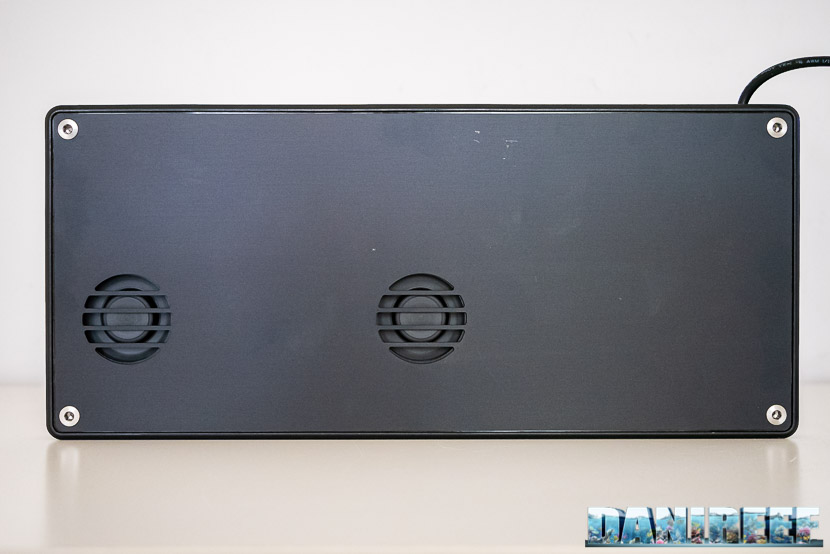
The Aqamai LRM is so well built, I’d almost call it perfect. Very thin, and it has a cooling system that is based on the temperature of the LEDs. If the temperature is too high, before it can damage the LEDs, the ceiling light switches into standby. This can happen when the ceiling light gets dirty and some dust accumulates in the outlet ducts, but this can be resolved easily by cleaning the light.
The Programming
The ceiling light can be used through an app available for Apple or Android and it works with the WiFi network created by the ceiling light itself. You can associate this wifi with your home network, and then control your ceiling light directly from your device, without choosing the specific network. This feature was added several months ago, so your old ceiling lights can also be controlled in this way. The app works very well and it’s very easy to use. It has various pre-set programs depending on the corals in the tank: SPS or LPS. 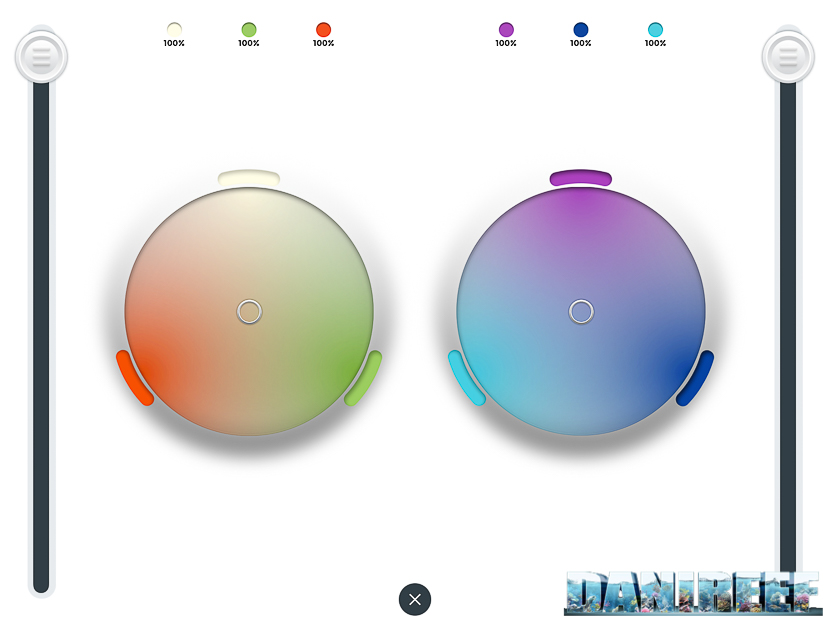
Pictured above is the manual control as it appears on an iPad: the two sliders represent the power provided and the two circle selectors, the color gradation. 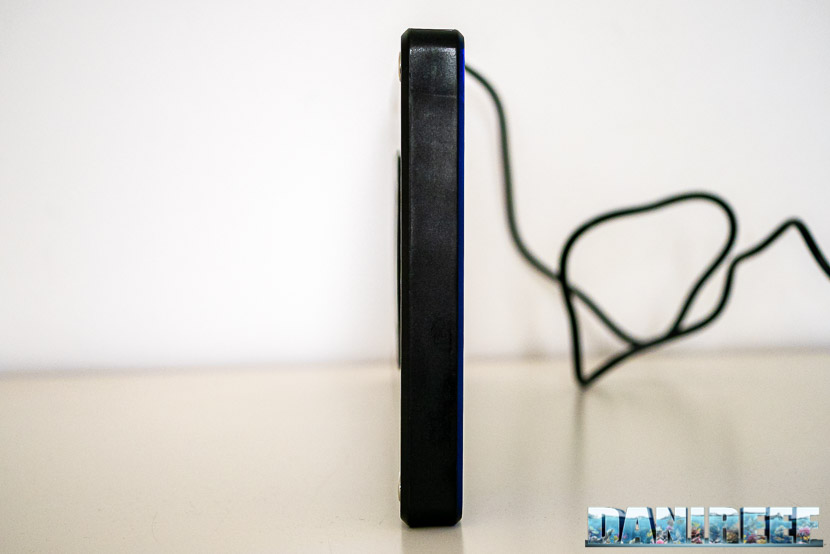
Our new working method DaniReef LAB for PAR measurement
During the long nights spent on our forum we always wondered how could we compare PAR from different ceiling lights. Even though we had the perfect device, the Quantum Meter MQ-510 di Apogee, we always referred only to the value measured at the center at about 20 cm of distance.
The Quantum Meter MQ-510 measures the PAR, expressed in PFFD (photosynthetic photon flux density) in μmol m-2 s-1. This device is calibrated to work underwater, so if it’s in air the measured value has to be divided by 1,32, which is the dive factor. We did the conversions. The values you’re going to see are correct. 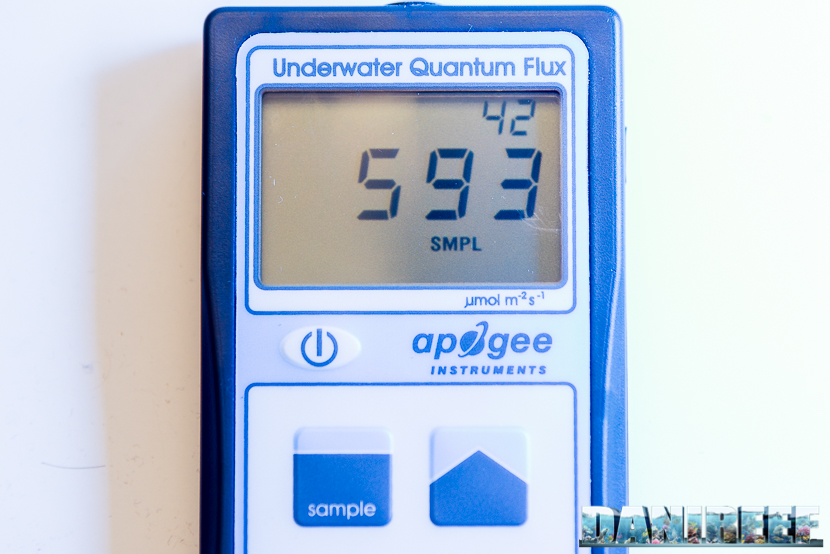
We decided to make a square base of 70×70 cm, and then set 17 fiducial points where we would place the sensor Quantum Meter MQ-510 and we also made 3 lifts of 20, 40, and 60 cm for the ceiling light, to have the same distance from the sensor. This will allow us to create curves in the space that can be compared to that of other ceiling lights, all at the same distances. Notice that this distance is measured between the base of the sensor and the ceiling light. In reality it should be decreased of 3.5 cm, which is the height of the measurement cylinder, and increased by 0.5 cm. which is the dimension of the spacers that lift the ceiling light. 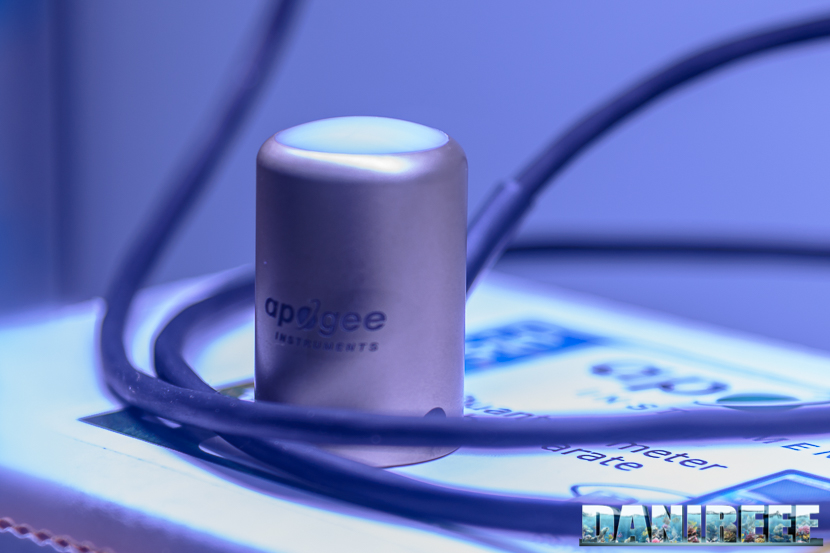
The three measurements are made at 17, 37, and 57 cm of distance. Because they’re done in air they will be corrected.
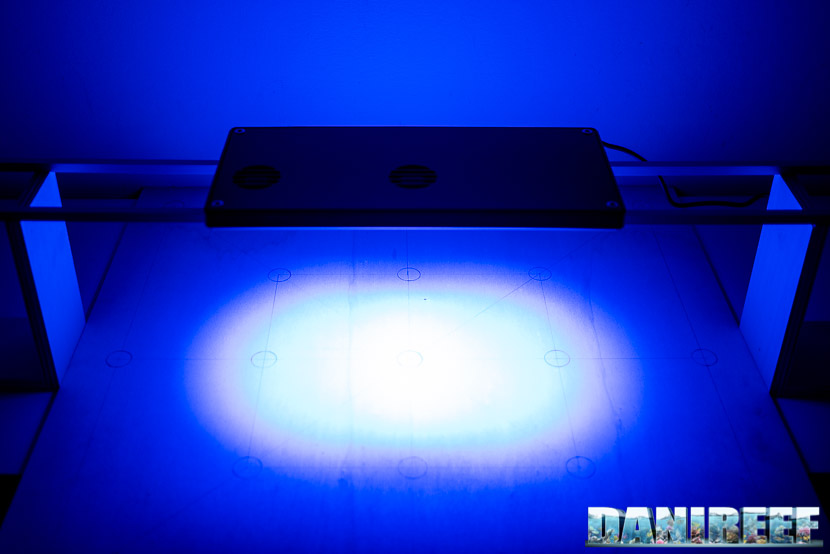
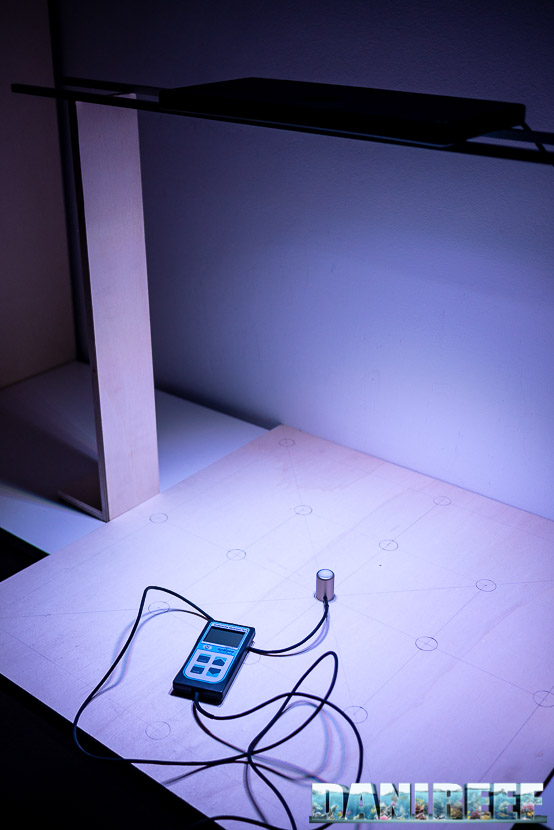
PAR measurement from 17 cm of distance
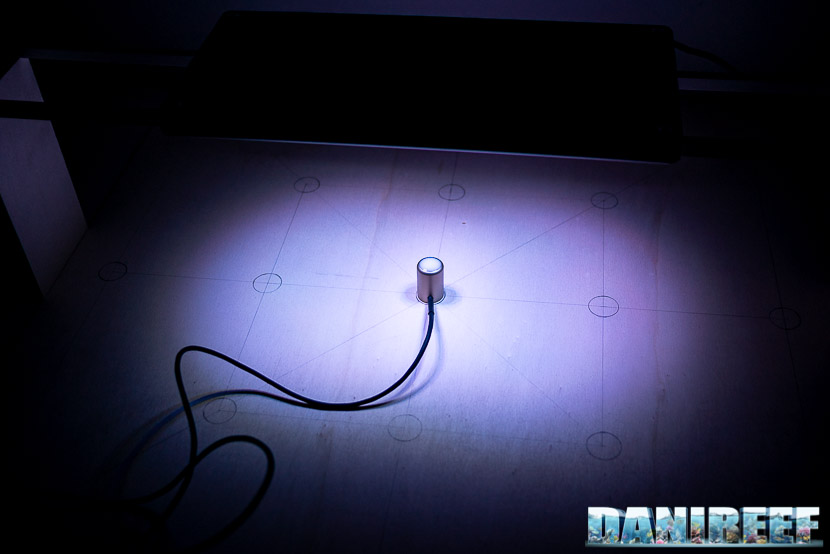
Here is what the setup looks like. Below there are the chart and the device, and above is the ceiling light placed on the aluminum bars.
Here are the collected values: 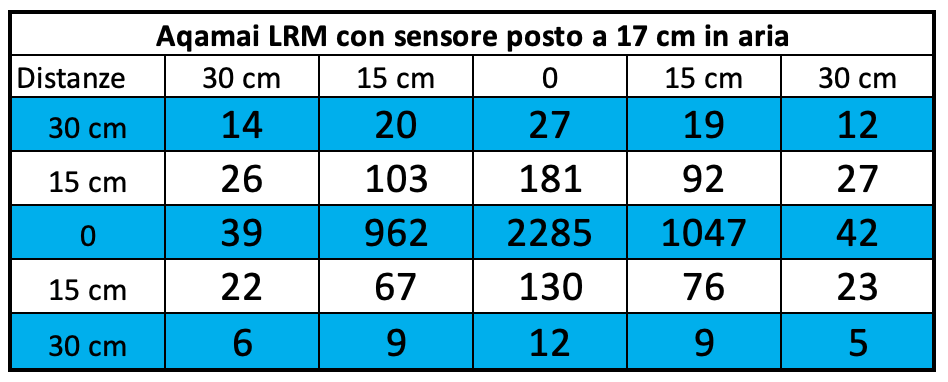
And for the corresponding chart we will use the same scale for ceiling lights with similar power. So, if you read the article on the new Philips CoralCare, you will find the same evaluation scale. 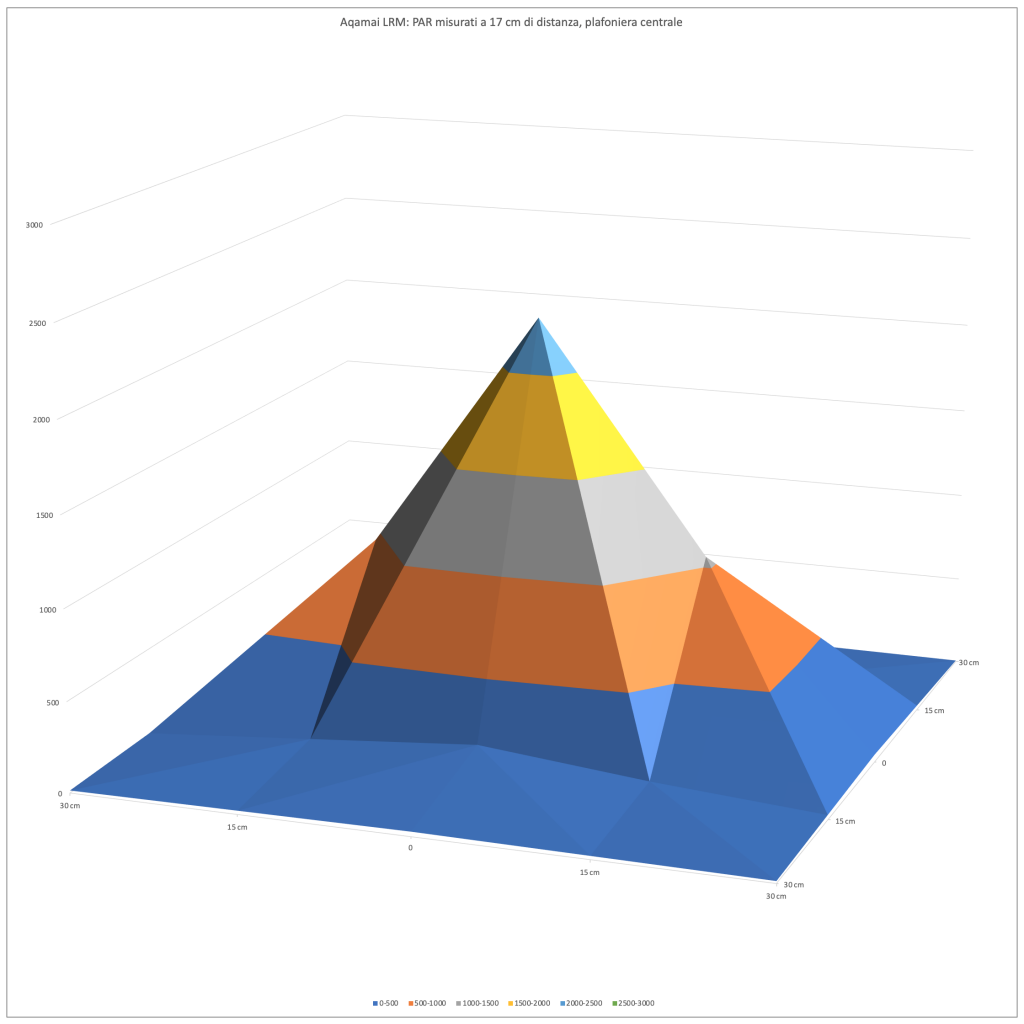
Because the ceiling light was very close to the sensor, and with it being a double cluster model pretty contained in its dimensions, it’s obvious that the PAR quickly decreases on all the sides. But the chart (embracing an area of 60×60 cm) will show its usefulness when we compare different ceiling lights. It immediately stands out that the peak value, measured in the middle, is higher than the Philips CoralCare’s.
PAR measurement from 37 cm of distance
Here is what the setup looks like. Below there are the chart and the device, and above is the ceiling light placed on the aluminum bars.
Here are the collected values: 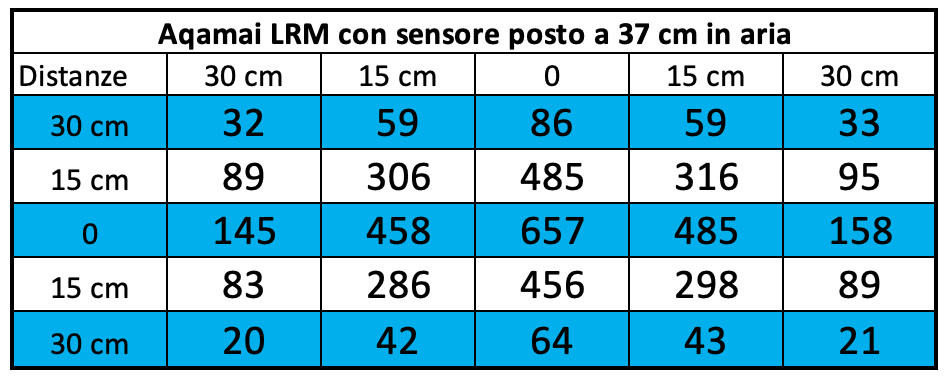
And for the corresponding chart we will use the same scale for ceiling lights with similar power. 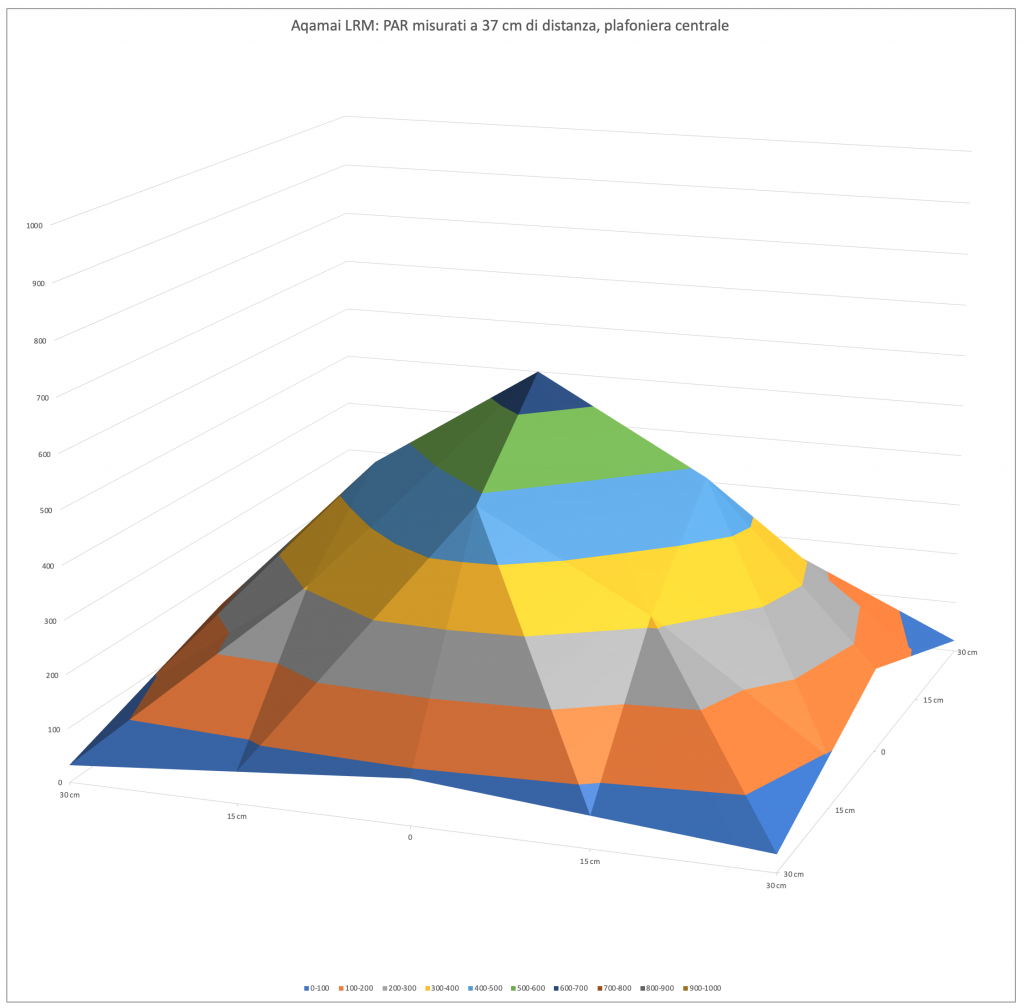
With a bigger space between ceiling lights and sensor, the difference between PAR in the middle and on the sides decreases. The light spreads, but the central value decreases from 2285 to 657 μmol m-2 s-1.
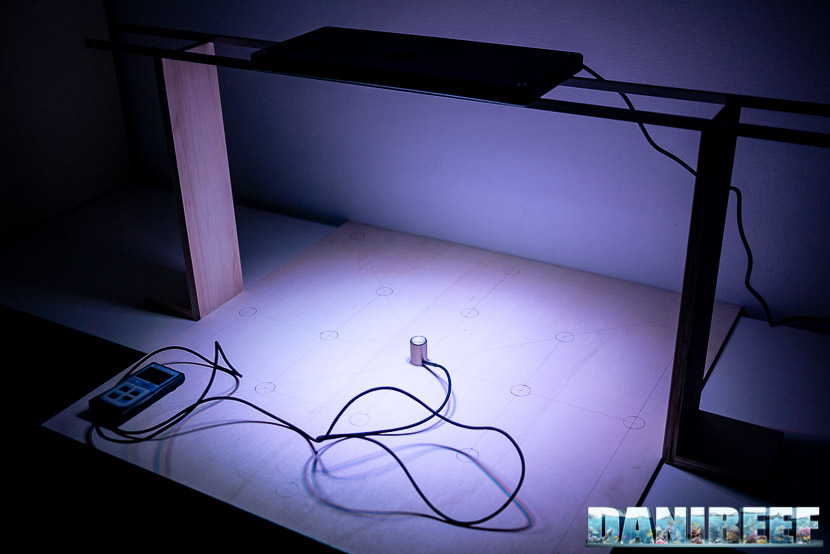
PAR measurement from 57 cm of distance
Here is the setup for the the test. Below is the chart, and from this distance we can see the device and the ceiling light placed on the aluminum bars. The illuminated area is much wider, so the specific power per cm decreases.
Here are the collected values: 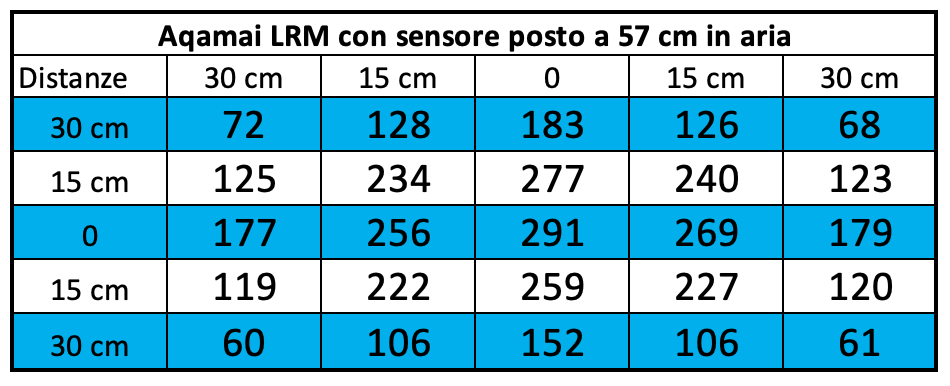
And for the corresponding chart we will use the same scale for ceiling lights with similar power. 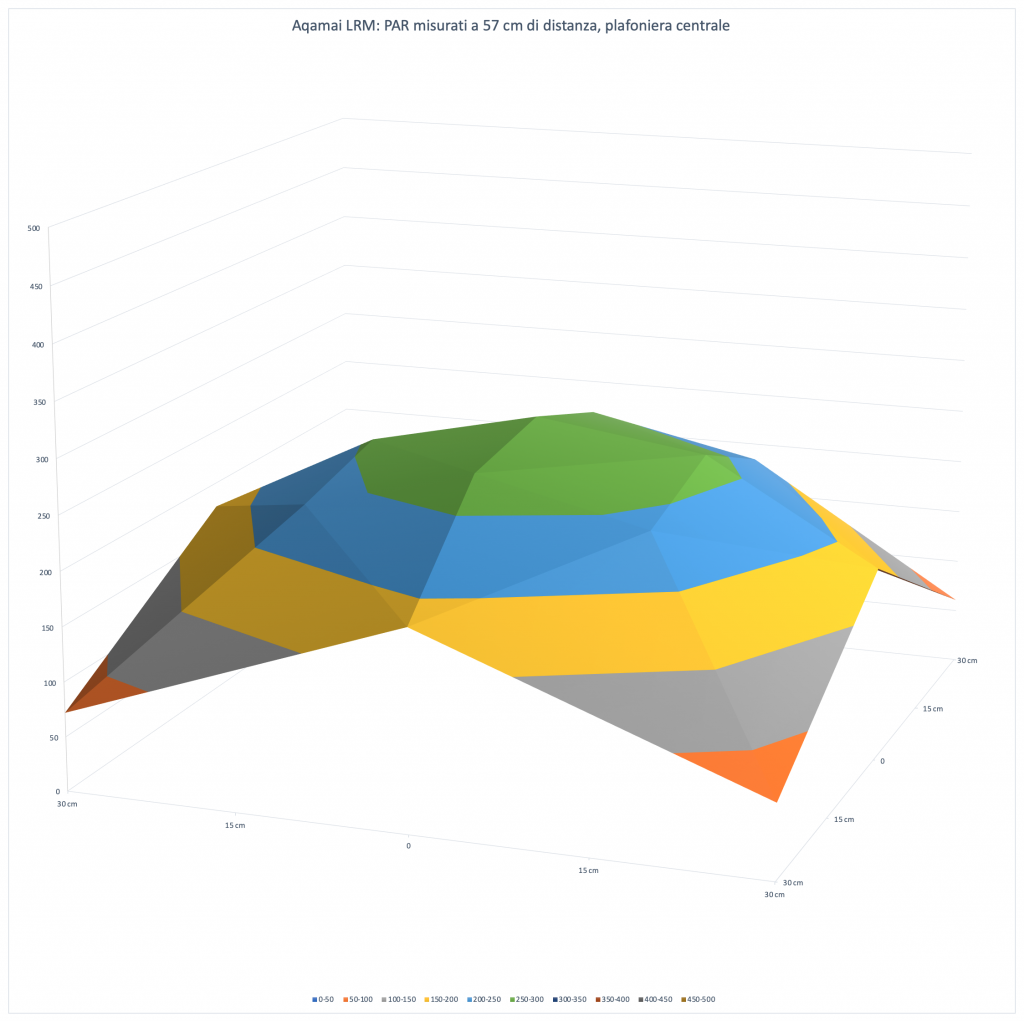
Increasing the space between ceiling light and sensor, decreases the difference between PAR in the middle and on the sides. We have more uniformity, as expected. The light spreads, but the central value decreases from 2285 to 657 and to 291 μmol m-2 s-1.
Now it’s clear that the coverage is wide.
The PAR in the center in the different configurations
Let’s continue with our technical measurements. We can see how, in a chart, the PAR collected in the middle decreases in the three different distances of the tests. 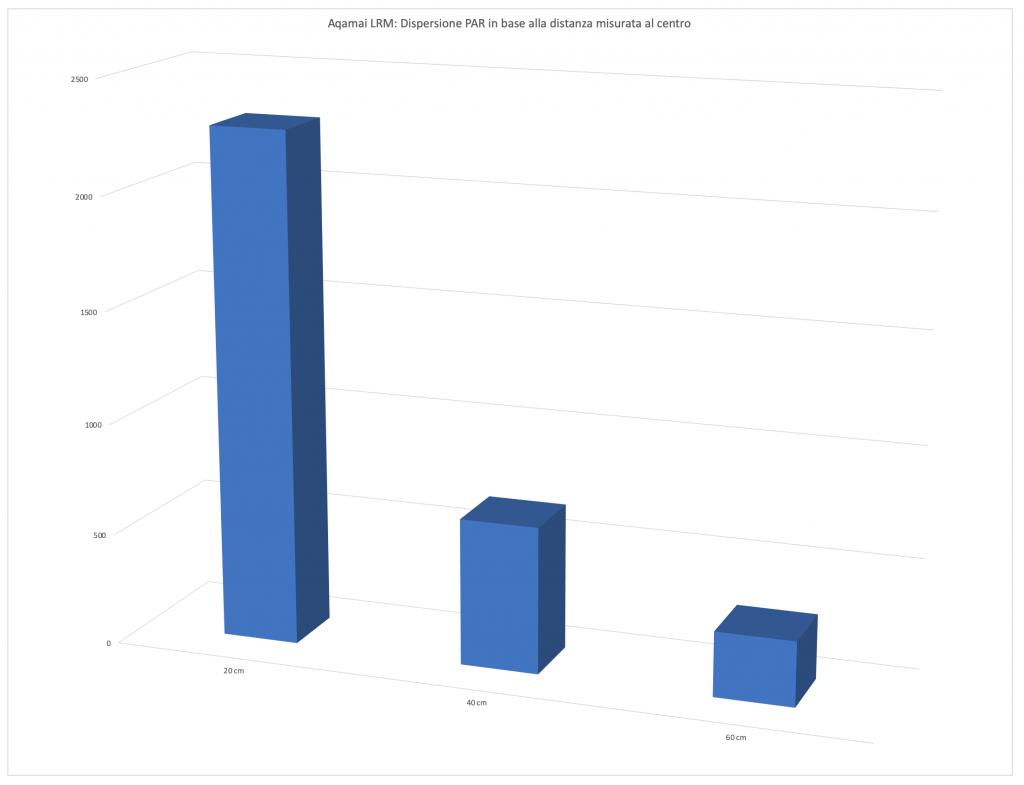
Energy variation of the Aqamai LRM depending on the distances
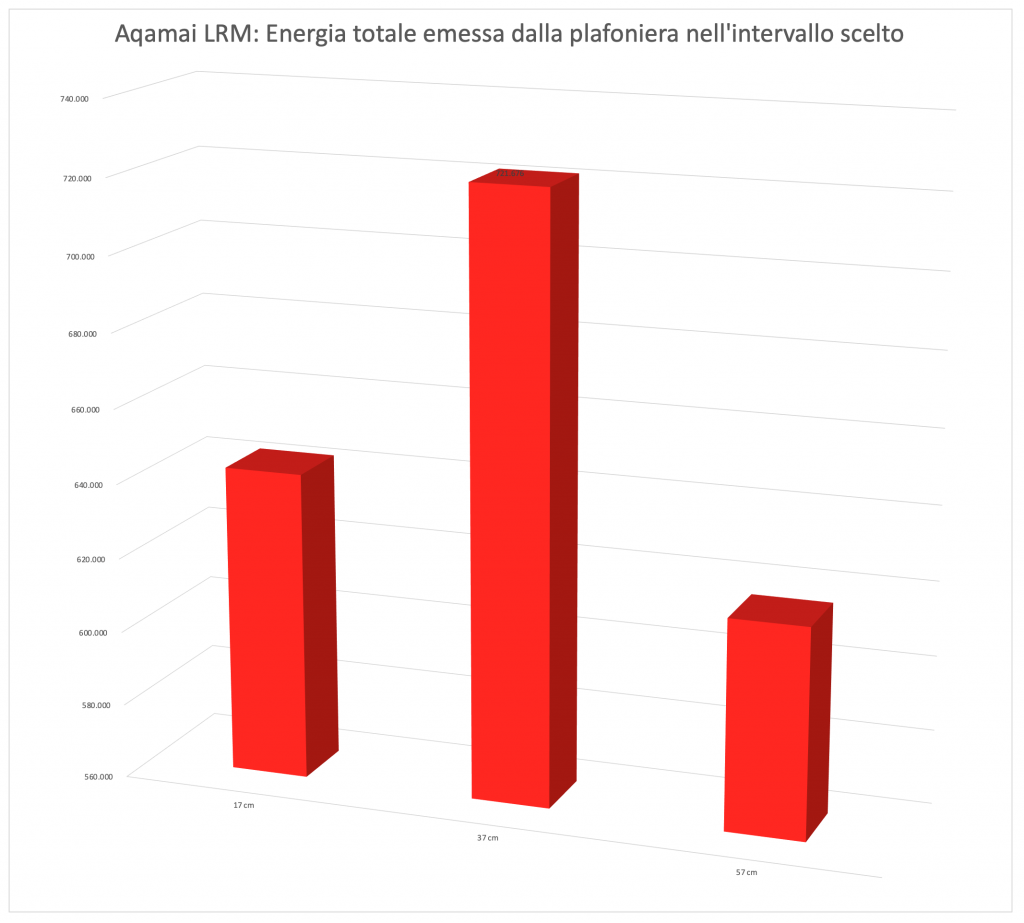
This one is the most significant and most comparable measurements: the energy variation. We calculated the volumes of the three surfaces previously seen. It’s obvious that when moving away from the ceiling light, the PAR also decreases and the light illuminates a wider space. In this way you can consider all the light energy contained in the 60×60 cm area subtended by the ceiling light. And the three values 642,649; 721,676; and 616,460 assume a different connotation compared to the values in the middle. When the first decrease because of the increasing of the distances, the subtended area, that is the energy, at first increases, because the main part of the lighting is in the middle, then it decreases because part of the energy is spread out of this area.
In fact, looking at the values of the three curves you can see that at the sides there’s more light at 57 cm than at 37 cm.
Values per channel in the middle in the three distances
We also measured the values for each channel, but only in the middle, in order to give you an idea of the contribution of the different channels on the PAR produced. 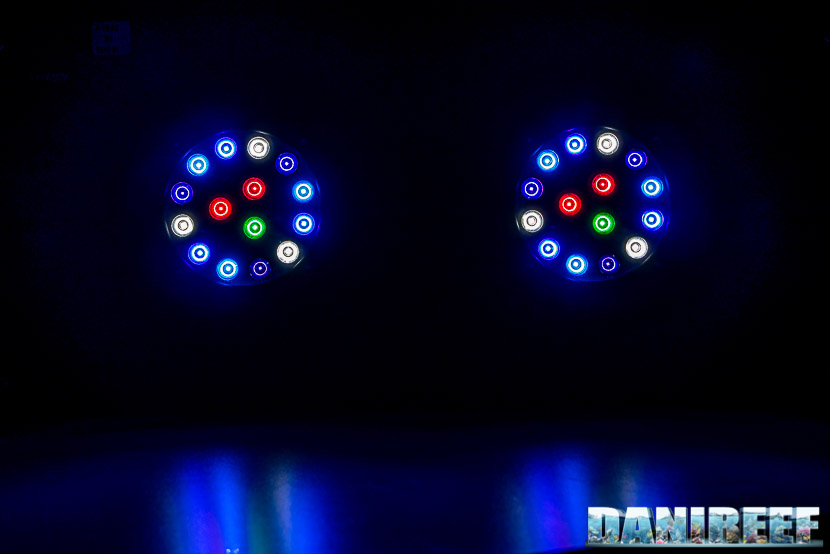
Let’s take a look at the measured values:
| Distance = 17 cm | Distance = 37 cm | Distance = 57 cm | |
| 1 Purple channel | 220 μmol m-2 s-1 | 51 μmol m-2 s-1 | 22 μmol m-2 s-1 |
| 2 Blue channel | 640 μmol m-2 s-1 | 197 μmol m-2 s-1 | 89 μmol m-2 s-1 |
| 3 Cyan channel | 580 μmol m-2 s-1 | 172 μmol m-2 s-1 | 78 μmol m-2 s-1 |
| 4 White channel | 566 μmol m-2 s-1 | 161 μmol m-2 s-1 | 73 μmol m-2 s-1 |
| 5 Green channel | 62 μmol m-2 s-1 | 17 μmol m-2 s-1 | 7 μmol m-2 s-1 |
| 6 Red channel | 251 μmol m-2 s-1 | 67 μmol m-2 s-1 | 30 μmol m-2 s-1 |
The Blue channel has more PAR than the white channel, about 15%. PAR are predominant for the Blue and Cyan. The Green channel has a very small value.
How to translate these numbers to the aquarium?
This is a good question. At first we thought that we could transport these values to the aquarium tout-court. Then we filled the aquarium, inserted the probe, and redid the measurements. Basically, while at 20 cm the result is practically the same, but as we progressed, thanks to the glass reflecting the light and the water, we found values bigger than the values measured in air. Obviously this isn’t a detail that can be standardized, so we think that our method of calculation is the most correct, and the best for the comparison of different ceiling lights.
Consumption
The measurement of the consumption was made possible thanks to the useful device RCE PM600 that can also measure the Cos(fi) (or power factor). The result is given in watts.
The calculus of the absorbed current, which is the power, is as follows:
Ceiling light Aqamai LRM: 90.88 watt. Considering that at 17 cm the ceiling light has at the middle 2,285 μmol m-2 s-1, we can estimate that it will have a peak value of 25.14 μmol m-2 s-1 w-1 (PAR per watt). A higher value than Philips CoralCare, due to the choice of distribution.
The value is lower than the declared one of 100 w. Maybe it depends also on the fan rotation speed.
The comparison with other ceiling lights on the market
Recently we started to use the new Apogee’s Quantum Meter MQ-510. For this we can’t completely compare the data of other ceiling lights because before we used the probe Seneye. The Aqamai LRM is the second ceiling light with which we adopt this method, so there will come many more comparisons in the next weeks. Actually, we’ve already measured the values of the Cetus 2 and the Aqamai LRS.
But considering these two first-tested ceiling lights we can do an interesting comparison anyway.
| Energy | Price | Consumption | Energy/€ | Energy/w | |
| Aqamai LRM at 17 cm | 642,649 | 465 | 90.88 | 1,382 | 7,071 |
| Aqamai LRM at 37 cm | 721,676 | 465 | 90.88 | 1,552 | 7,941 |
| Aqamai LRM at 57 cm | 616,470 | 465 | 90.88 | 1,326 | 6,783 |
| Philips CoralCare at 17 cm | 1,858,572 | 749 | 190.50 | 2,481 | 9,756 |
| Philips CoralCare at 37 cm | 1,340,533 | 749 | 190.50 | 1,790 | 7,037 |
| Philips CoralCare at 57 cm | 933,246 | 749 | 190.50 | 1,246 | 4,899 |
The energy produced per watt is more constant in the Aqamai LRM than in the Philips. Same for the energy per watt when we progressively move away from the release point: it’s better with the Aqamai than the Philips; having the LEDs on the external surface means more loss on the sides. At 37 cm the values are pretty comparable, but we have to remember that the Philips has twice the costs and consumption, and therefore higher values.
| Ceiling light | PAR | Watt | Price | PAR/watt | euro per watt |
| GNC 466 | 696 (Seneye) | 120 | 1,400 euro | 5.8 spread | 11.7 |
| Orphek Atlantik V4 | 1,515 (Apogee) | 226 | 1,099 euro | 6.7 spread | 4.9 |
| Philips CoralCare 2019 | 2,088 (Apogee) | 190 | 749 euro | 11 spread | 3.9 |
| Maxspect Ethereal | 689 (Seneye) | 130 | 500 euro | 5.3 semi-spread | 3.8 |
| Led Bars Askoll Pure Marine | 237 (Apogee) | 28 | n.d. | 8.4 | |
| Zetlight UFO ZE-8000 | 791 (Seneye) | 91.5 | 500 euro | 8.6 cluster | 5,5 |
| Aqamai LRM | 2,285 (Apogee) | 90.88 | 465 euro | 25.14 double cluster | 5.1 |
The Aqamai LRM has the highest value of peak PAR per watt we’ve ever measured. The euro per watt values are average.
Mantainence costs
The Aqamai LRM ceiling lights costs 465 euro ($515 USD).
The absorbed power is 90.88 watt, so the relationship cost/watt is about 5.1 euro per watt. In order to do a comparison with the other ceiling lights you can refer to this chart:
| Ceiling light | Price | Consumption | Relationship euro per watt | |
| Philips Coralcare 2019 | 749 euro | 190 watt | 3.9 euro per watt | |
| Maxspect Ethereal | 500 euro | 126 watt | 4.0 euro per watt | |
| radion XR30w G2 PRO | 790 euro | 170 watt | 4.7 euro per watt | |
| radion XR30w G4 PRO | 915 euro | 190 watt | 4.8 euro per watt | |
| OceanLed Sunrise 600 | 870 euro | 180 watt | 4.8 euro per watt | |
| Orphek Atlantik V4 | 1099 euro | 226 watt | 4.9 euro per watt | |
| radion XR30w G2 | 690 euro | 140 watt | 4.9 euro per watt | |
| radion XR30w G4 | 760 euro | 150 watt | 5.1 euro per watt | |
| Aqamai LRM | 465 euro | 87.5 watt | 5.1 euro per watt | |
| Zetlight UFO ZE-8000 | 500 euro | 91.5 watt | 5.5 euro per watt | |
| CEAB Slide & Led | 2,700 euro | 275 watt | 9.8 euro per watt | |
| sicce GNC 466 | 1,592 euro | 120 watt | 13.3 euro per watt |
The ceiling light is very well built and easy to set up, especially if you use the preset programs. The PAR are very good especially in the middle and in terms of efficiency are perfect. Sure, they can’t compete with ceiling lights that consume twice as much, even if they have a perfect performance for their consumption. Perfect for demanding corals probably in an area of 30×30 cm. It has an average cost per watt relationship and a record peak PAR per watt. What else we can ask for?
Questions and comments, as always, are welcomed. And most of all, do you like our measuring method? [Translated by Agnese Poggi]


0 Comments