
Our new method DaniReef LAB for PAR measurement of the AquaIllumination Hydra 32 HD
Backstory: (this paragraph is the same for all the ceiling lights tested with our DaniReef method in order to explain the working method) During the long nights spent on our forum (here) we always wondered how could we compare PAR from different ceiling lights. Even though we had the perfect device, the Quantum Meter MQ-510 di Apogee, we always referred only to the value measured at the center at 20 cm of distance, more or less.
The Quantum Meter MQ-510 measures the PAR, expressed in PFFD that is photosynthetic photon flux density in μmol m-2 s-1. This device is calibrated to work underwater, so if it’s in air the measured value has to be divided by 1.32 – the dive factor. We have to do the conversion. The values you’re going to see are correct. 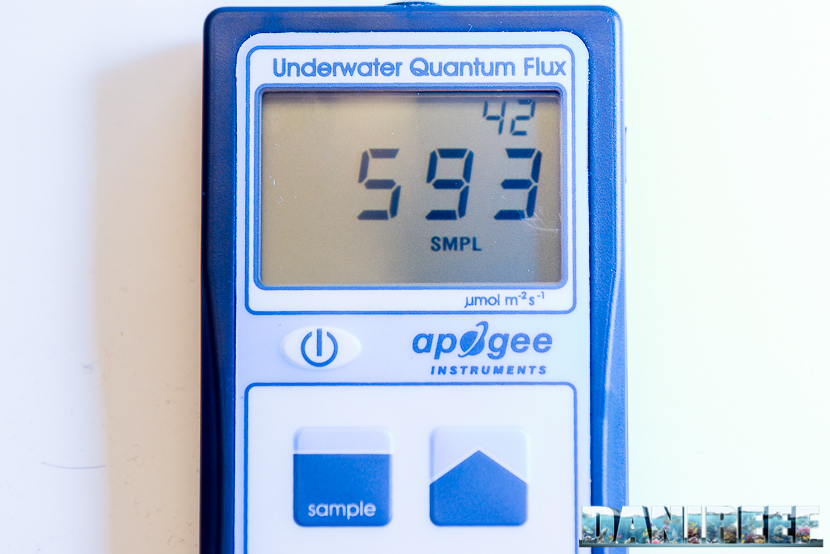
We decided to make a square base of 70×70 cm, we set 17 fiducial points where we placed the Quantum Meter MQ-510 sensor and we also made 3 lifts of 20, 40, and 60 cm for the ceiling light, in order to have the same distance from the sensor. This will allow us to create the curves which can be compared to other ceiling lights’, all tested at the same distances. Note that this distance is measured between the base of the sensor and the ceiling light. In reality it should be decreased by 3.5 cm which is the height of the measurement cylinder and increased by 0.5 cm which is the dimension of the spacers that lift the ceiling light. 
In total the three measurements are made at 17, 37, and 57 cm of distance. Because they’ve been done in air they will be corrected.
PAR measurement at 17 cm
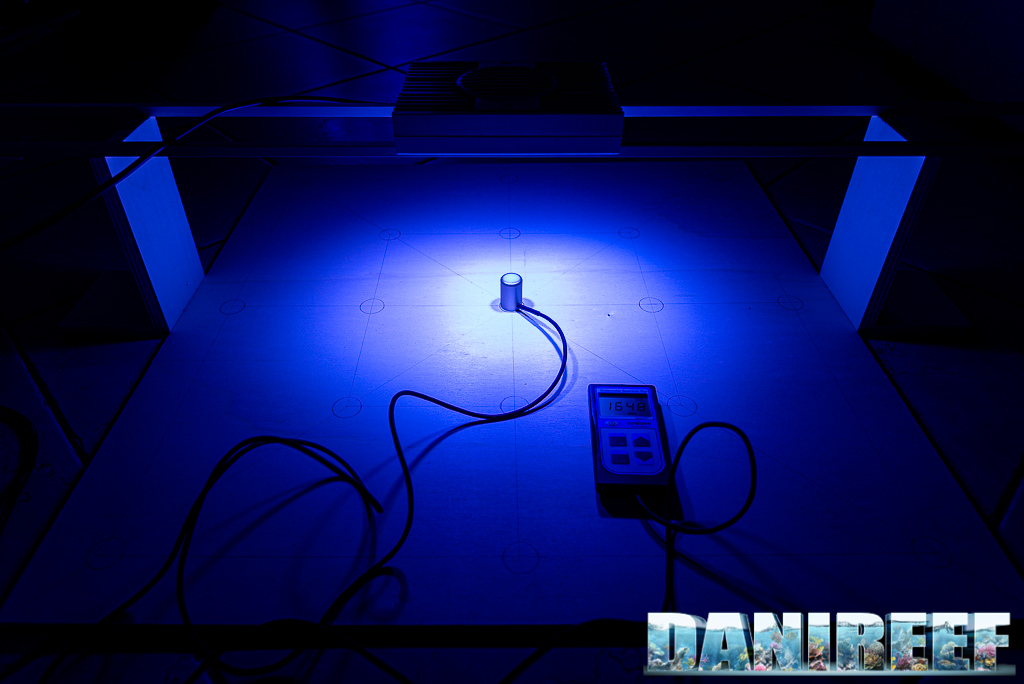
This is the test setup. On the bottom is the chart and the device, and at the top is the ceiling light placed on the aluminum bars.
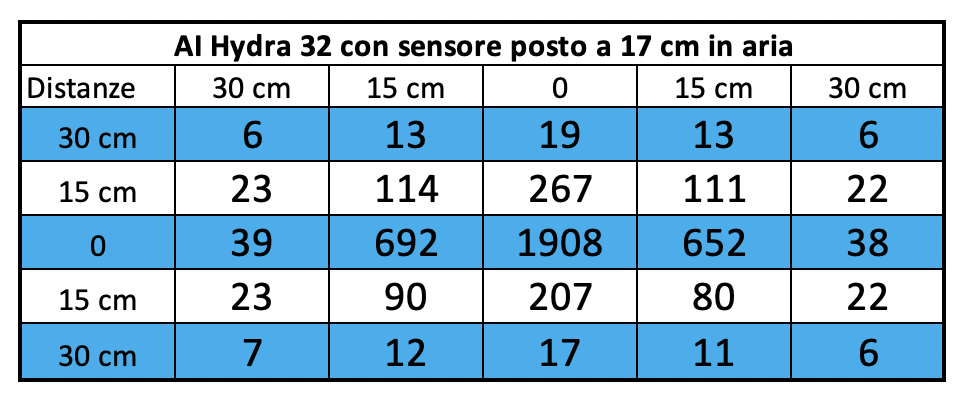
Here are the collected values:
And here is the corresponding chart, we came back to our classic scale in order to compare similar ceiling lights. 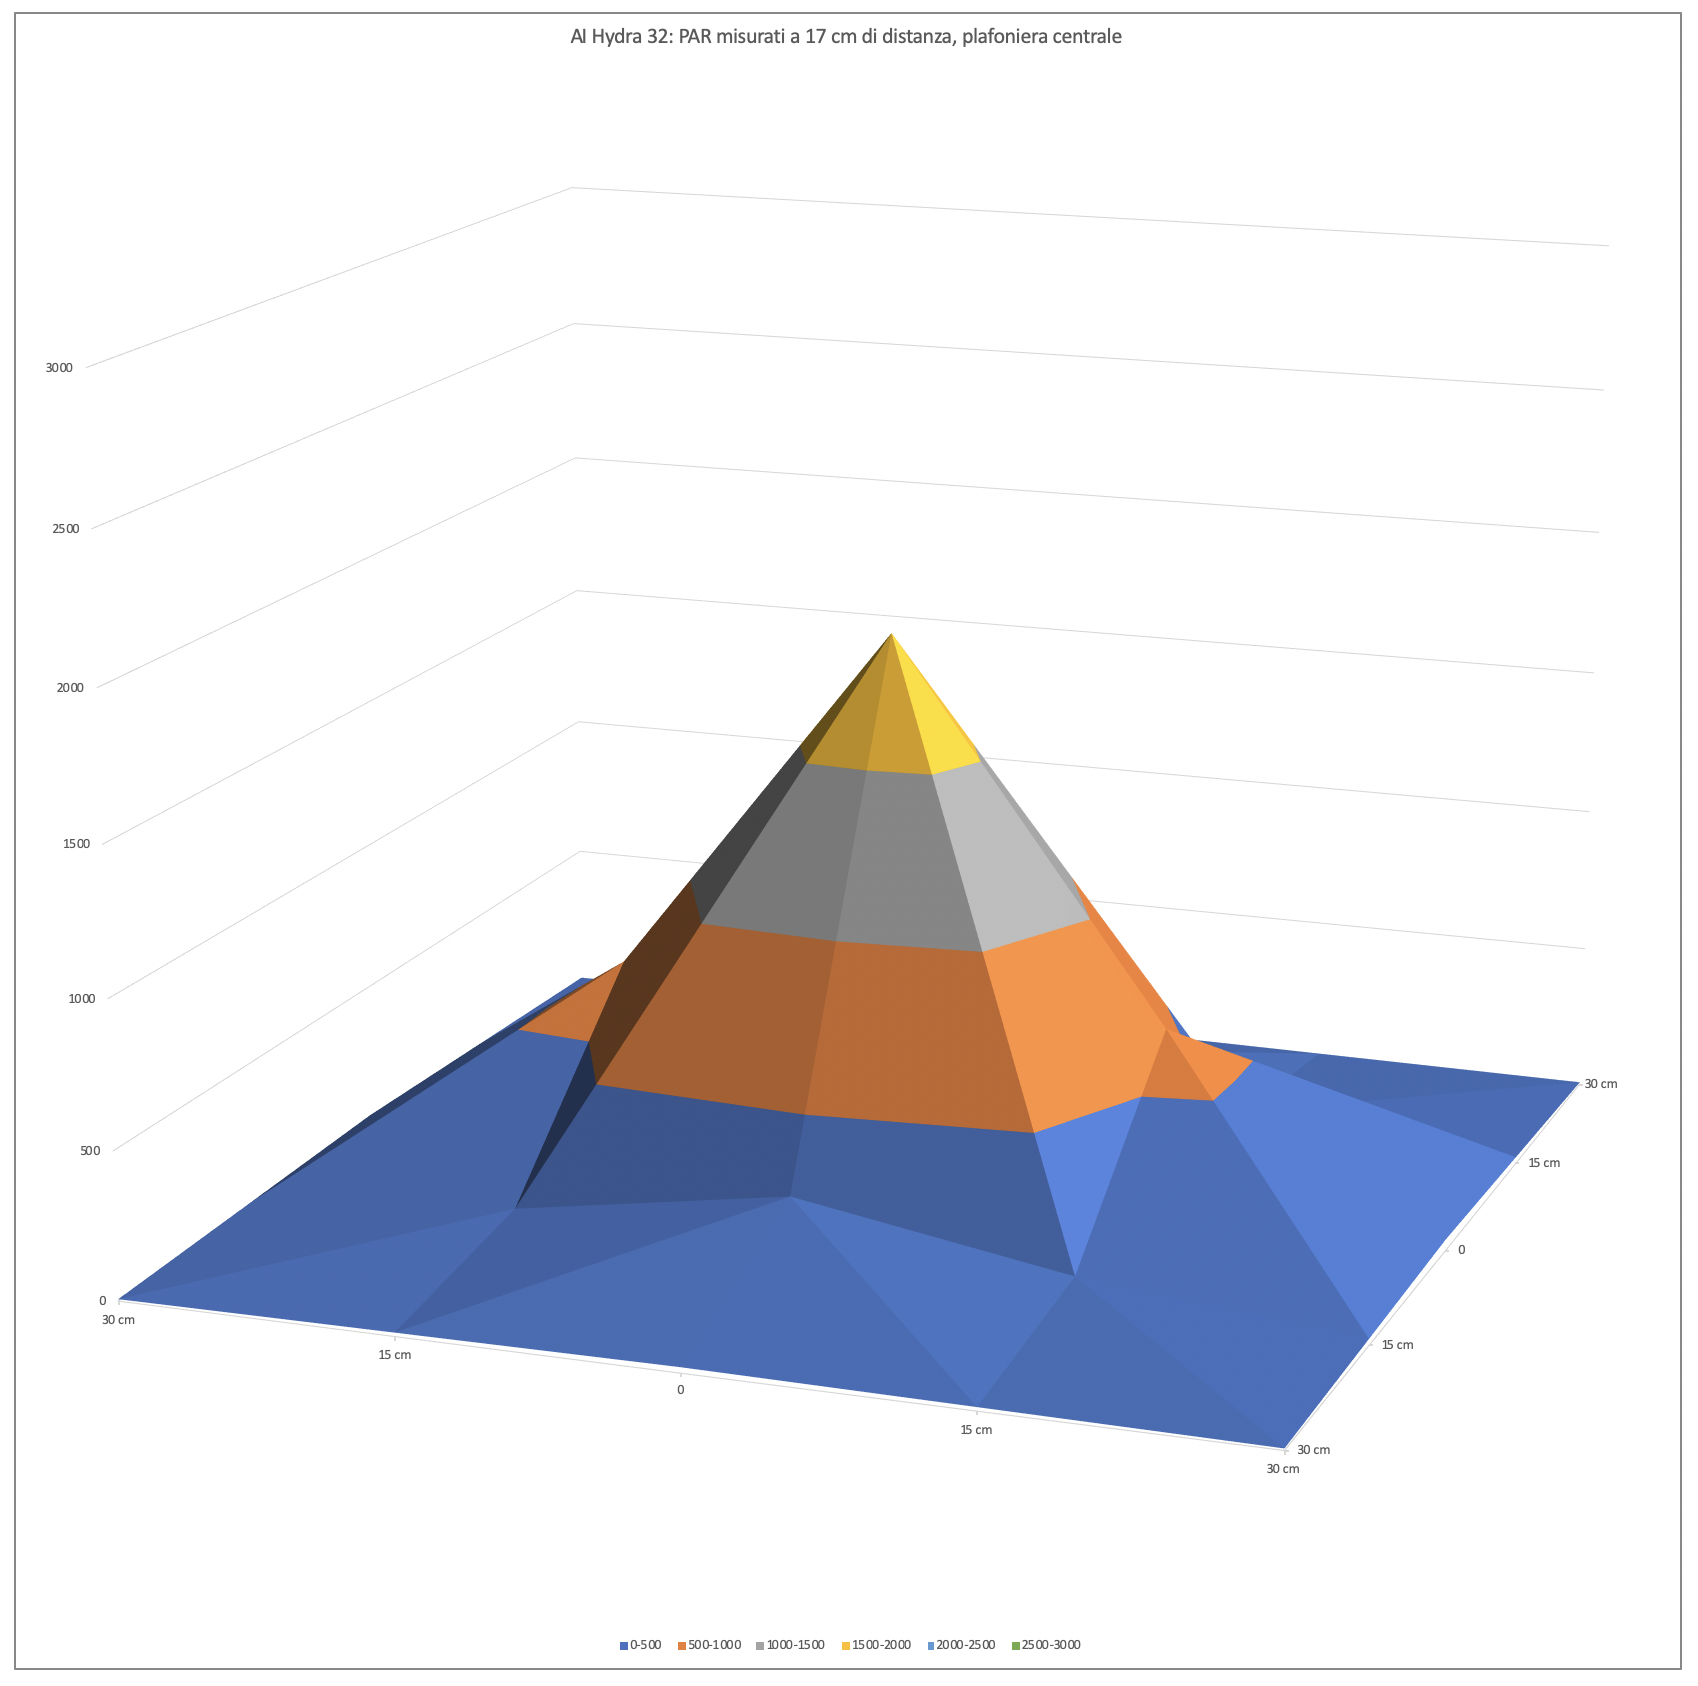
The first measurement has the shorter distance between sensor and ceiling light. But you can see how the light distribution is pretty concentrated. Consider that we have a base of 60×60 which is a definitely a lot for such a small ceiling light. But it’s obvious that the PAR quickly decrease on all the sides.
PAR measurement at 37 cm
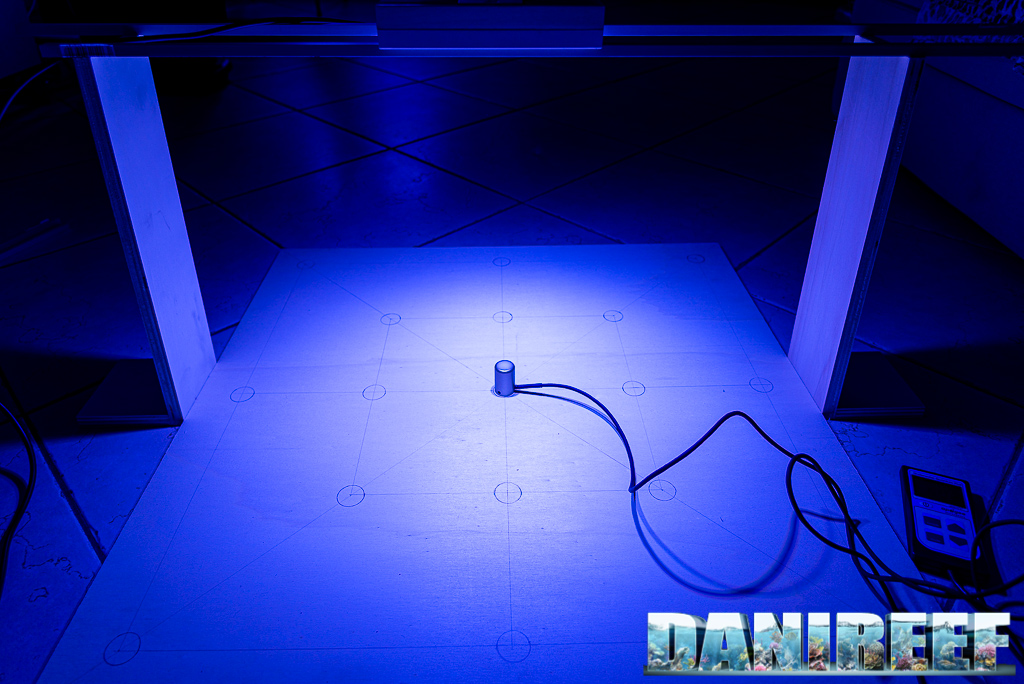
This is the test setup. On the bottom is the chart and the device, and at the top is the ceiling light placed on the aluminum bars.
Here are the collected values: 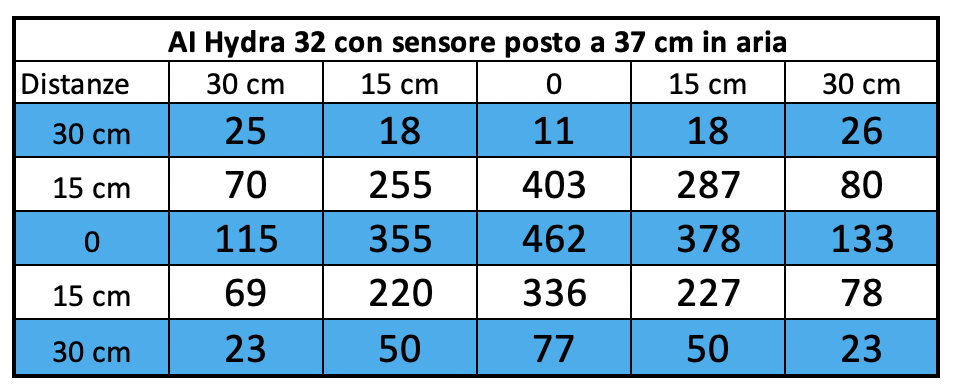
And here is the corresponding chart. 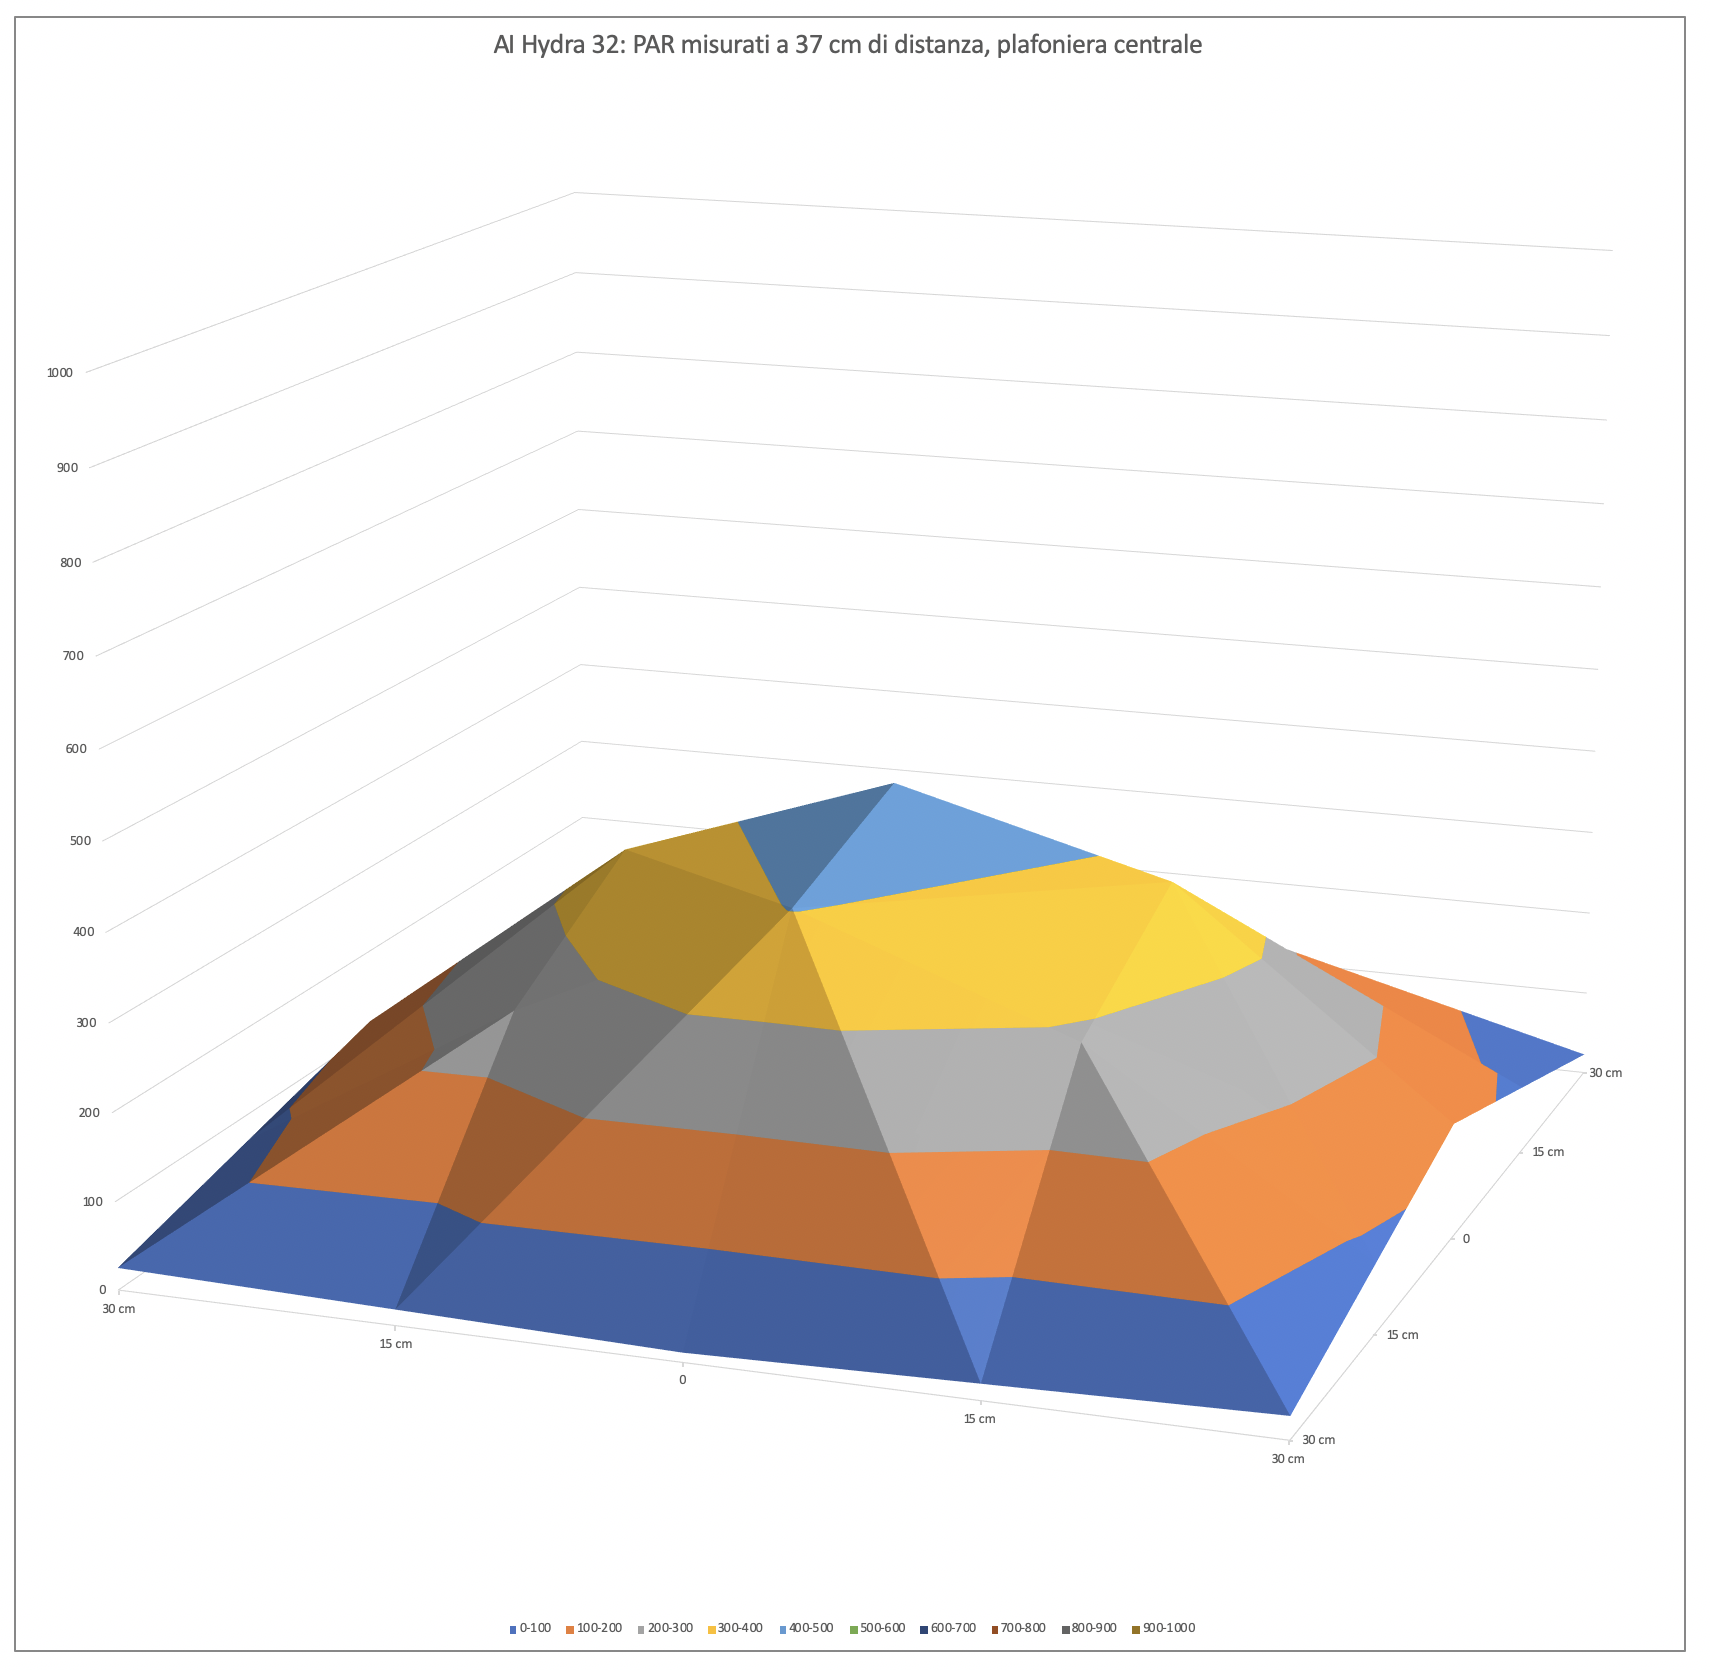
With more space between ceiling light and sensor, there is a decrease in the difference between PAR in the middle and on the sides. The light spreads, the difference between the middle and the sides is of a distributed light lamp, and the central value decreases from 1908 to 462 μmol m-2 s-1.
PAR measurement at 57 cm
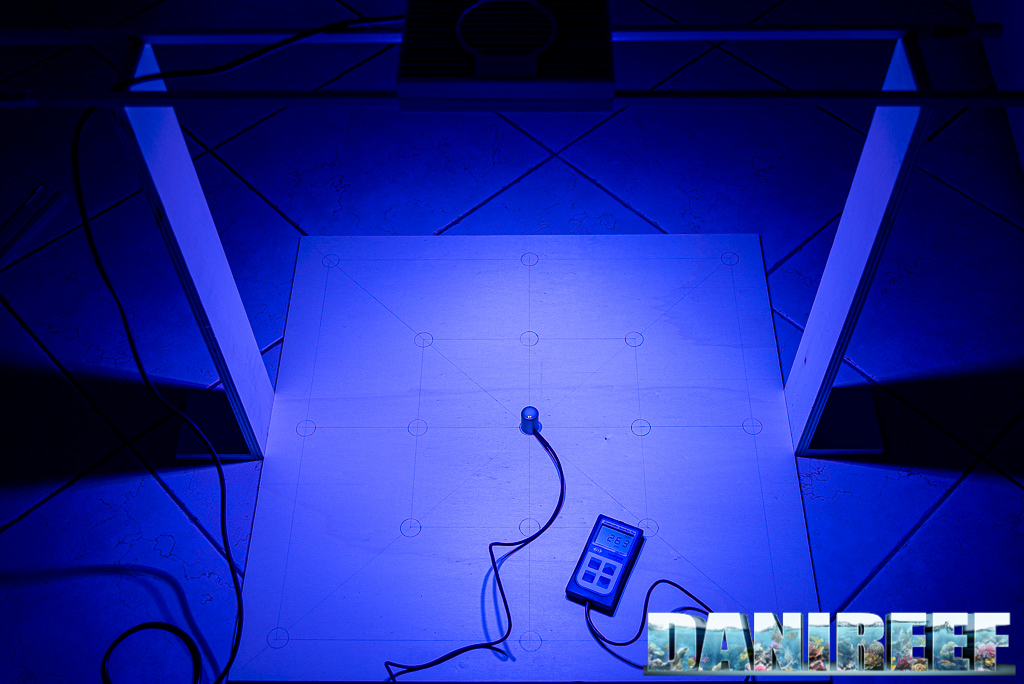
This is the test setup. On the bottom is the chart and the device, and at the top is the ceiling light placed on the aluminum bars.Even visually the illuminated area is wider, so the specific power per cm decreases.
Here are the collected values: 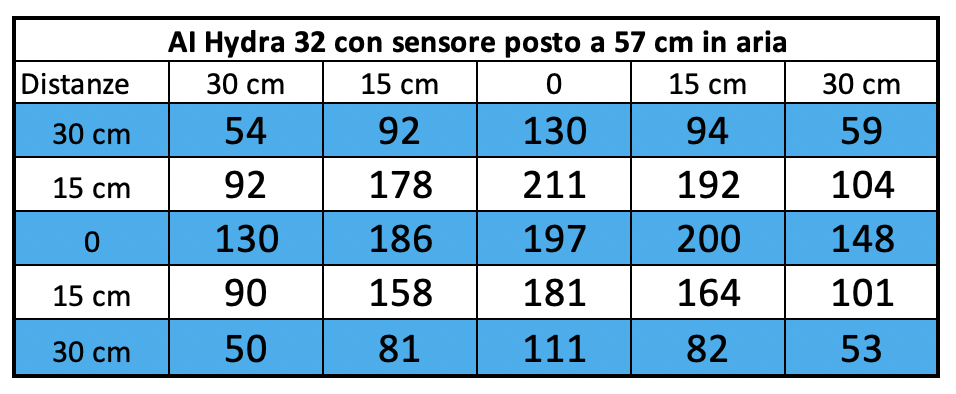
And here is the corresponding chart. 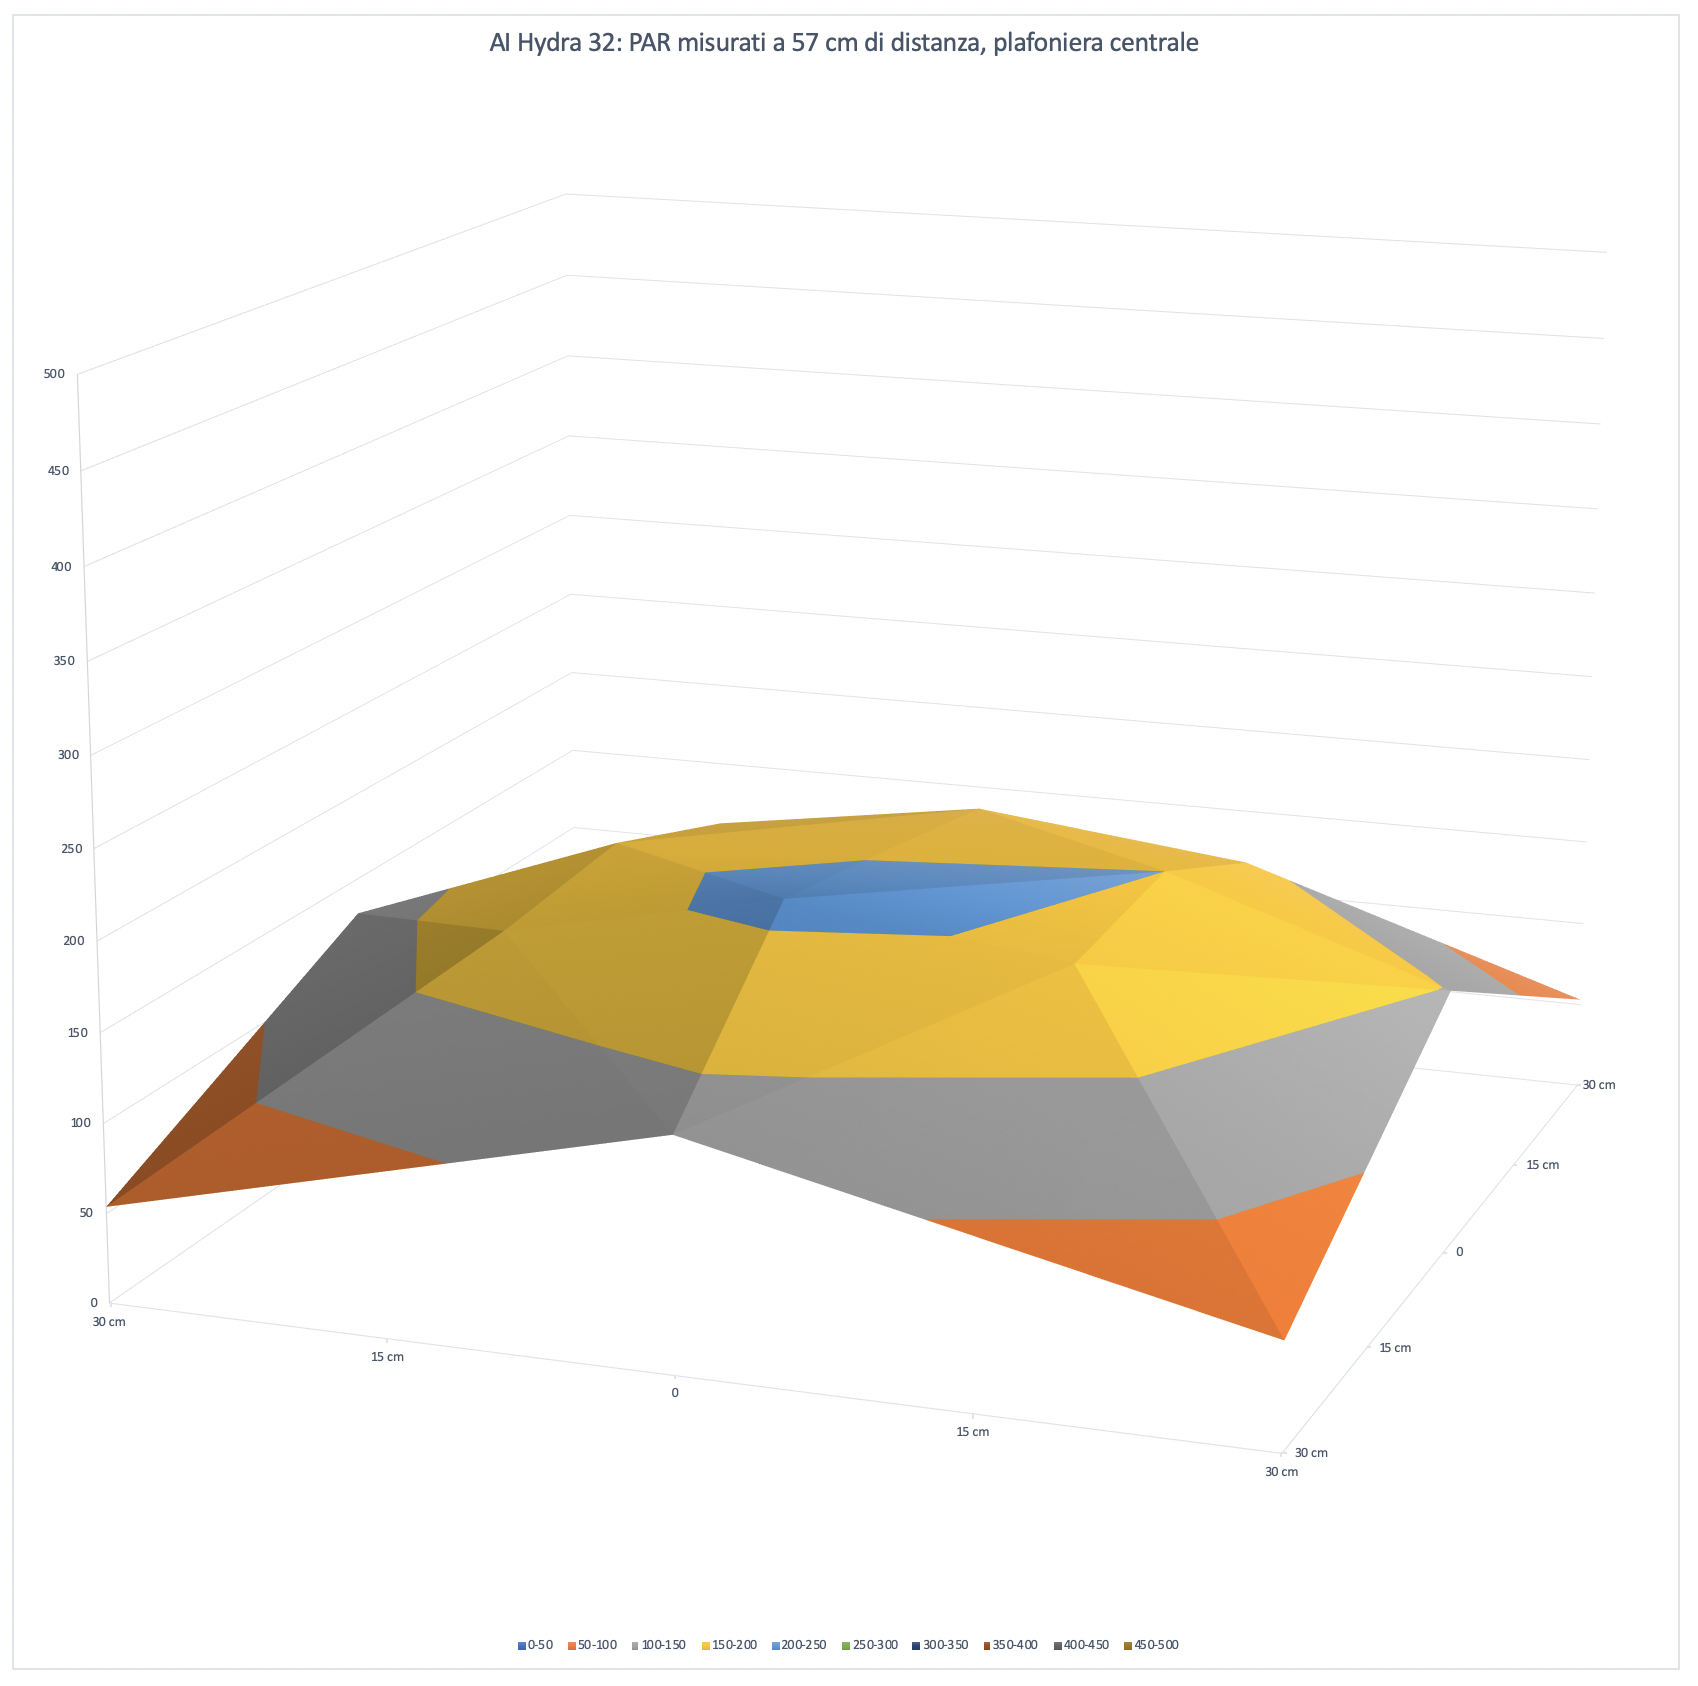
Increasing the space between ceiling light and sensor even more continues to lessen the difference between PAR in the middle and on the sides. We have more uniformity, as expected, but the final power decreases a lot. The light spreads, while the central value decreases from 1908 to 462 to 197 μmol m-2 s-1.
It sticks out that the coverage is uniform.
The PAR in the middle in the different configurations
Let’s continue with our technical measurements. We can see how, in a chart, the PAR collected in the middle decrease in the three different distances of the tests. 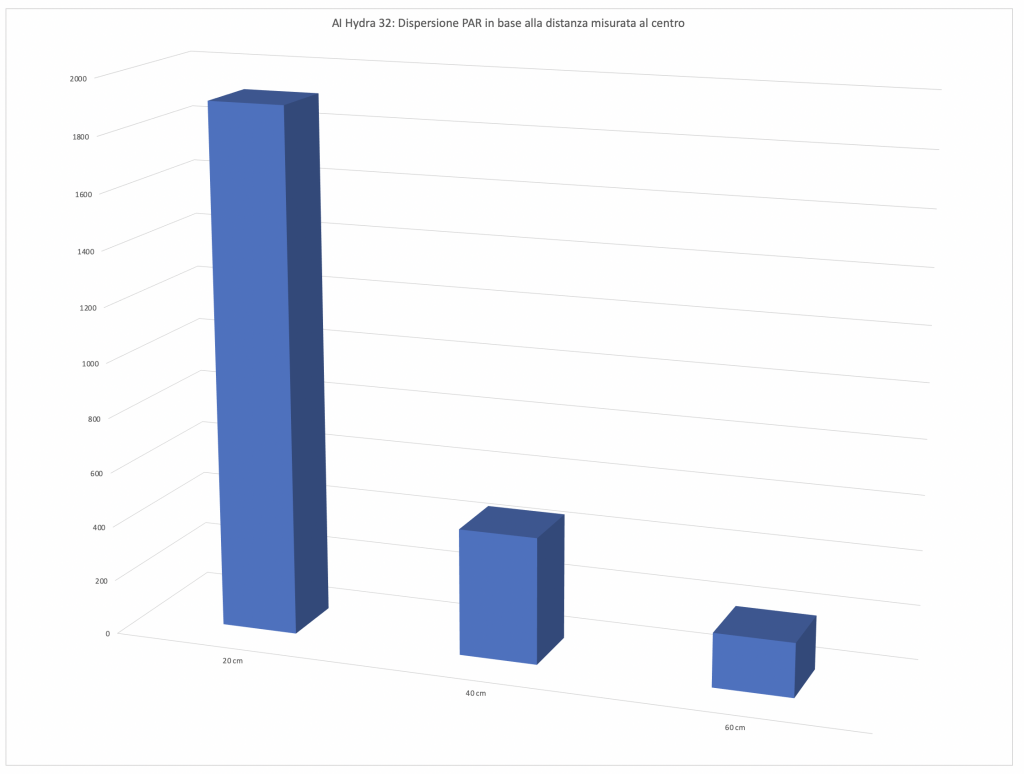
Energy variation of the AI Hydra 32 HD depending on the distance
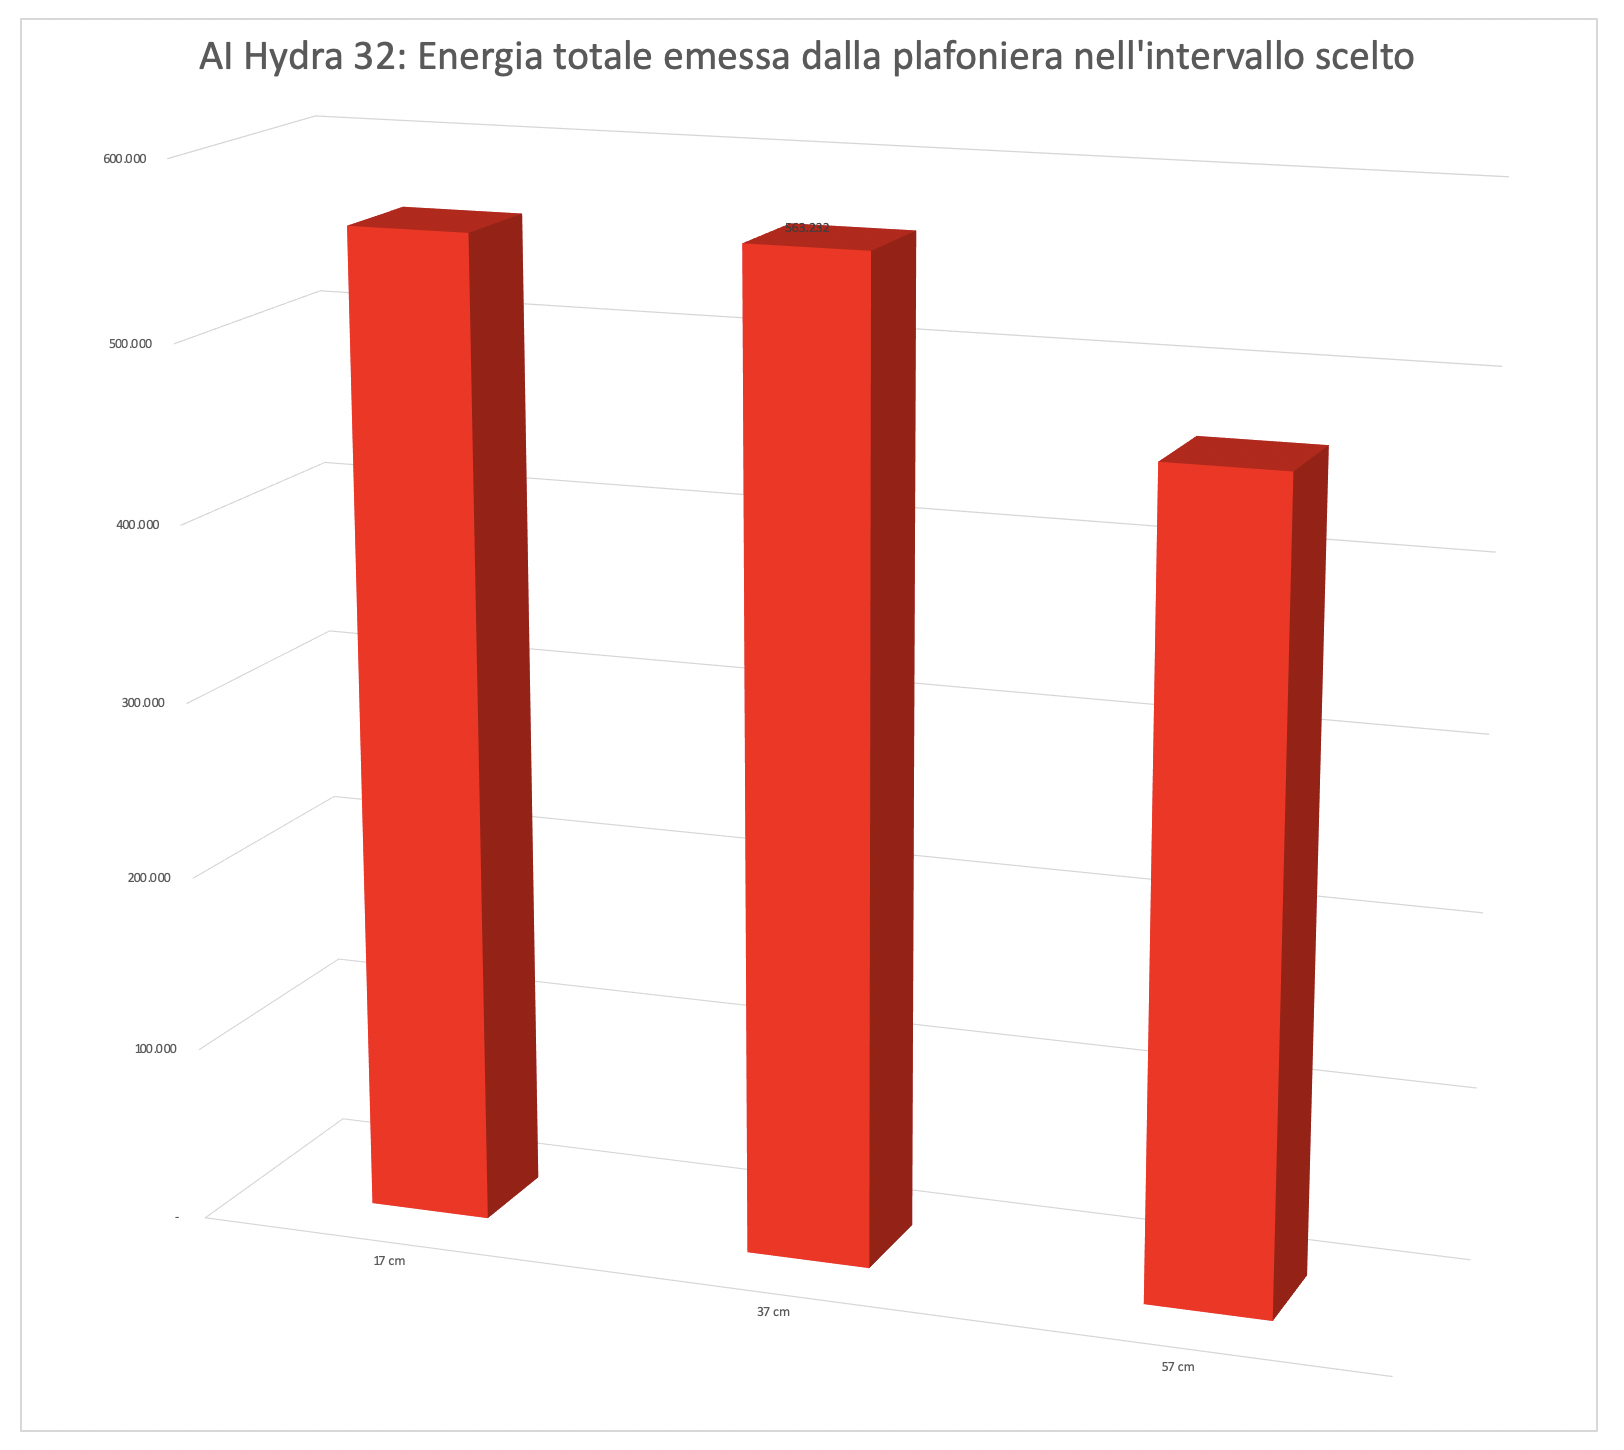
This is the most significant and most comparable data. The energy variation. We calculated the volumes of the three surfaces previously seen. It’s obvious that moving away from the ceiling light the PAR decrease, but the light illuminates a wider space. In this way you can consider all the light energy contained in the 60×60 cm area subtended by the ceiling light. And the three values 560,185, 563,232 and 462,614 assume a different connotation compared to the values in the middle. While the first decrease because of the increasing of the distances, the subtended area, that is the energy, decreases less, because the main part of the lighting is in the middle.
In fact, looking at the values of the three curves you can see that at the sides there is more light at 37 cm than at 17 cm.
Values per channel in the middle in the three distances
We also measured the values per each channel, but only in the middle, in order to give you an idea of the contribution of different channels on PAR produced. 
Let’s take a look at the measured values:
| Distance = 17 cm | Distance = 37 cm | Distance = 57 cm | |
| Channel 1 | 97 μmol m-2 s-1 | 30 μmol m-2 s-1 | 13 μmol m-2 s-1 |
| Channel 2 | 92 μmol m-2 s-1 | 31 μmol m-2 s-1 | 14 μmol m-2 s-1 |
| Channel 3 | 595 μmol m-2 s-1 | 144 μmol m-2 s-1 | 61 μmol m-2 s-1 |
| Channel 4 | 473 μmol m-2 s-1 | 110 μmol m-2 s-1 | 48 μmol m-2 s-1 |
| Channel 5 | 53 μmol m-2 s-1 | 11 μmol m-2 s-1 | 5 μmol m-2 s-1 |
| Channel 6 | 110 μmol m-2 s-1 | 24 μmol m-2 s-1 | 11 μmol m-2 s-1 |
| Channel 7 | 11 μmol m-2 s-1 | 3 μmol m-2 s-1 | 2 μmol m-2 s-1 |
| Channel 8 | 518 μmol m-2 s-1 | 120 μmol m-2 s-1 | 52 μmol m-2 s-1 |
There are three channels that are mainly responsible for PAR emission of this ceiling light: Royal Blue, Blue, and Warm White. In total, from 17 cm, they constitute the first 1586 μmol m-2 s-1, and the other 5 only 363 μmol m-2 s-1 . That’s 81%! So if you decrease green and red you wouldn’t have this great result.
The ceiling lights by AquaIllumination are distributed in Italy by ReefLine, and come with a good warranty. [Translated by Agnese Poggi]
How to value these numbers in aquarium?
This is a good question. At first we thought that we could transport these values to the aquarium tout-court. We filled the aquarium, insert the probe and redone the measurements. Basically, while at 20 cm the result is practically the same, as we progressed, thanks to the glass and the water itself reflecting the light, we found even the double of the values measured in air. Obviously this isn’t a detail that can be standardized, so we think that our method of calculation is the most correct, and the best for the comparison of coverages of different ceiling lights.
Power Consumption
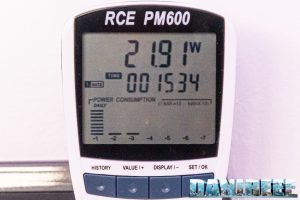
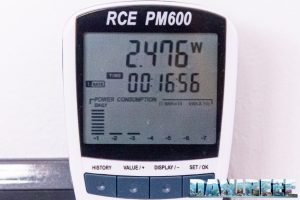
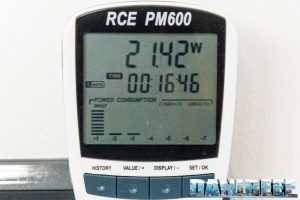
The measurement of the consumption was made possible thanks to the useful RCE PM600 that can also measure the Cos(fi) (or power factor). The result is already given in watts. 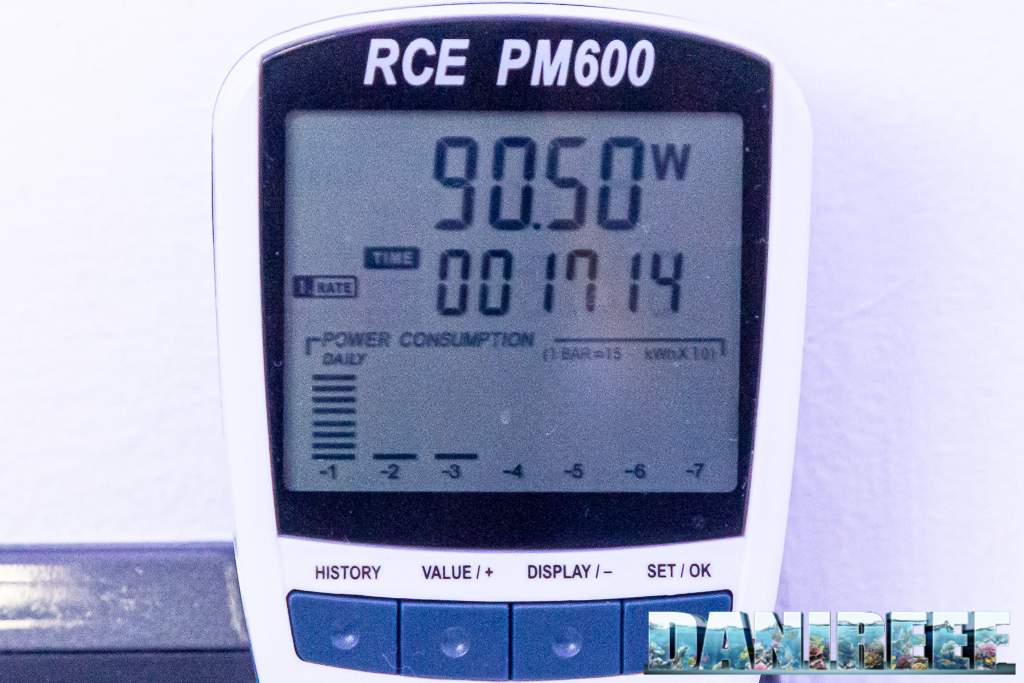
Above is the maximum power and below is the Cos(fi). 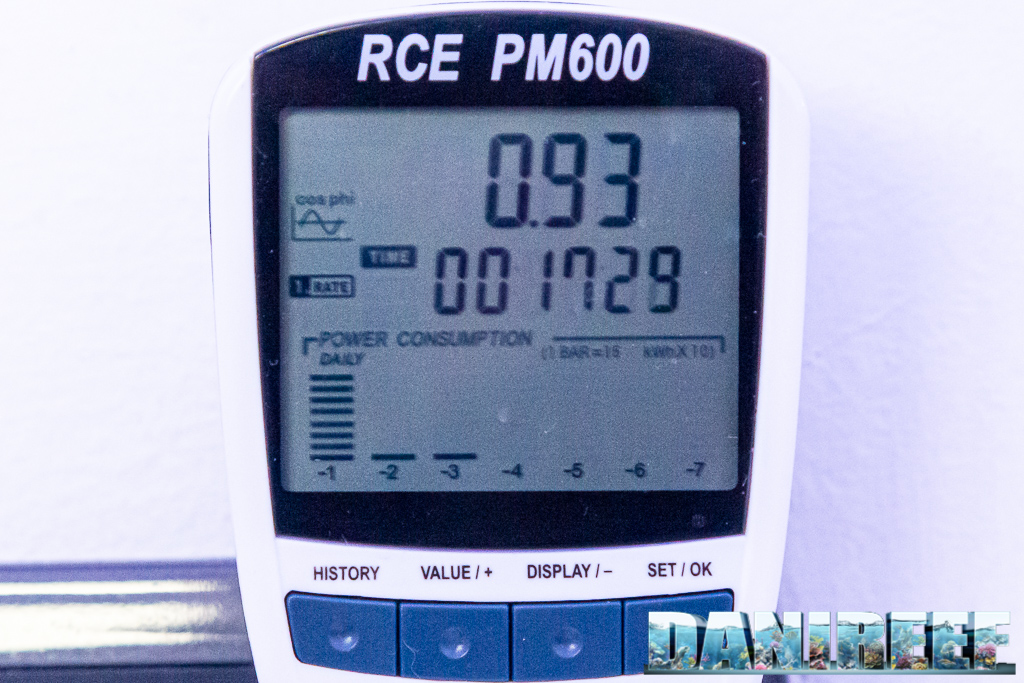
The calculation of the absorbed current, that is the power, is as follows:
AquaIllumination Hydra 32HD ceiling light: 90.5 watt. Considering that from 17 cm the ceiling light has at the middle 1908 μmol m-2 s-1, we can guess that it will have a peak value of 21.08 μmol m-2 s-1 w-1 (PAR per watt).
The power consumption is in line with what is declared and indicated by the app. But we are more interested in the PAR value than the similarity with the declared data, because we want to know what this ceiling light allows us to breed.
The comparison with other ceiling lights on the market
Recently we started to use the new Apogee’s Quantum Meter MQ-510. For this we can’t completely compare the data of other ceiling lights because until recently, we used the Seneye probe.
But considering the first ceiling lights we managed to test we can do an interesting comparison about their produced energy:
| Energy | Cost | Consumption | Energy/€ | Energy/w | |
| AI Hydra 32 HD at 17 cm | 560.185 | 430 | 90,50 | 1.303 | 6.190 |
| AI Hydra 32 HD at 37 cm | 563.232 | 430 | 90,50 | 1.310 | 6.224 |
| AI Hydra 32 HD at 57 cm | 462.614 | 430 | 90,50 | 1.076 | 5.112 |
| Aqamai LRM at 17 cm | 642.649 | 465 | 90,88 | 1.382 | 7.071 |
| Aqamai LRM at 37 cm | 721.676 | 465 | 90,88 | 1.552 | 7.941 |
| Aqamai LRM at 57 cm | 616.470 | 465 | 90,88 | 1.326 | 6.783 |
| Cetus 2 at 17 cm | 409.993 | 215 | 60,68 | 1.906 | 6.756 |
| Cetus 2 at 37 cm | 290.866 | 215 | 60,68 | 1.353 | 4.793 |
| Cetus 2 at 57 cm | 173.651 | 215 | 60,68 | 807 | 2.861 |
| Philips CoralCare at 17 cm | 1.858.572 | 749 | 190,50 | 2.481 | 9.756 |
| Philips CoralCare at 37 cm | 1.340.533 | 749 | 190,50 | 1.790 | 7.037 |
| Philips CoralCare at 57 cm | 933.246 | 749 | 190,50 | 1.246 | 4.899 |
The energy per watt is lower than the similar Aqamai LRM; we think it is because of the additional LED channel (not counting the moonlight channel). So, the more the LED that are white, the higher the efficiency, the more you consider the sides, especially UV and Purple, the lower the efficiency. It’s the price you pay for a wider spectrum.
| Ceiling light | PAR | Watt | Price | PAR/watt | euro per watt | euro per PAR |
| GNC 466 | 696 (Seneye) | 120 | 1.400 euro | 5,8 spread | 11,7 | 2,01 |
| Orphek Atlantik V4 | 1.515 (Apogee) | 226 | 1.099 euro | 6,7 spread | 4,9 | 0,73 |
| Philips CoralCare 2019 | 2.088 (Apogee) | 190 | 749 euro | 11 spread | 3,9 | 0,35 |
| Maxspect Ethereal | 689 (Seneye) | 130 | 500 euro | 5,3 semi-spread | 3,8 | 0,72 |
| Barra Led Askoll Pure Marine | 237 (Apogee) | 28 | n.d. | 8,4 | ||
| Zetlight UFO ZE-8000 | 791 (Seneye) | 91,5 | 500 euro | 8,6 cluster | 5,5 | 0,63 |
| Aqamai LRM | 2.285 (Apogee) | 90,88 | 465 euro | 25,14 double cluster | 5,1 | 0,20 |
| AI Hydra 32 HD | 1.908 (Apogee) | 90.50 | 430 euro | 21,08 double cluster | 4,75 | 0,23 |
| Cetus 2 | 746 (Apogee) | 60,68 | 215 | 12,29 cluster | 3,5 | 0,28 |
The AI Hydra 32 HD has a very low value of euro per PAR, passed only by the Cetus 2. The efficiency is the highest. It’s one of the most efficient ceiling lights, and for 430 euro it’s hard to ask for more.
Cost
The AI Hydra 32 HD ceiling lights cost 429,90 euro. ($505 USD)
The absorbed power is 90.50 watts, so the relationship euro per watt is 4,75 euro ($5.59 USD) for each watt. In order to do a comparison with the other ceiling lights you can refer to this chart:
| Ceiling light | Price | Consumption | Relationship euro/watt | |
| Cetus 2 | 215 euro | 60,68 watt | 3,5 euro per watt | |
| Philips Coralcare 2019 | 749 euro | 190 watt | 3,9 euro per watt | |
| Maxspect Ethereal | 500 euro | 126 watt | 4,0 euro per watt | |
| Radion XR30w G2 PRO | 790 euro | 170 watt | 4,7 euro per watt | |
| AI Hydra 32 HD | 430 euro | 90,5 watt | 4,75 euro per watt | |
| Radion XR30w G4 PRO | 915 euro | 190 watt | 4,84 euro per watt | |
| OceanLed Sunrise 600 | 870 euro | 180 watt | 4,8 euro per watt | |
| Orphek Atlantik V4 | 1099 euro | 226 watt | 4,9 euro per watt | |
| Radion XR30w G2 | 690 euro | 140 watt | 4,9 euro per watt | |
| Radion XR30w G4 | 760 euro | 150 watt | 5,1 euro per watt | |
| Aqamai LRM | 465 euro | 87,5 watt | 5,1 euro per watt | |
| Zetlight UFO ZE-8000 | 500 euro | 91,5 watt | 5,5 euro per watt | |
| CEAB Slide & Led | 2.700 euro | 275 watt | 9,8 euro per watt | |
| Sicce GNC 466 | 1.592 euro | 120 watt | 13,3 euro per watt |
The ceiling light is very well built, heavy and solid. Easy to be programmed, with a very fast and direct program. The efficiency is very high even if it lacks a bit of power compared to other ceiling lights. The perfect coverage is about 30-40 cm of distance, then it decreases. The values are perfect for nanoreefs and tanks up to 60 cm of width, both for easy SPS and other animals. The global energy expressed is very good and linear. The dispersion on the sides in minimal within 60 cm.
Questions and comments, as always, are welcomed.
Our new method DaniReef LAB for PAR measurement of the AquaIllumination Hydra 32 HD
Backstory: (this paragraph is the same for all the ceiling lights tested with our DaniReef method in order to explain the working method) During the long nights spent on our forum (here) we always wondered how could we compare PAR from different ceiling lights. Even though we had the perfect device, the Quantum Meter MQ-510 di Apogee, we always referred only to the value measured at the center at 20 cm of distance, more or less.
The Quantum Meter MQ-510 measures the PAR, expressed in PFFD that is photosynthetic photon flux density in μmol m-2 s-1. This device is calibrated to work underwater, so if it’s in air the measured value has to be divided by 1.32 – the dive factor. We have to do the conversion. The values you’re going to see are correct.
We decided to make a square base of 70×70 cm, we set 17 fiducial points where we placed the Quantum Meter MQ-510 sensor and we also made 3 lifts of 20, 40, and 60 cm for the ceiling light, in order to have the same distance from the sensor. This will allow us to create the curves which can be compared to other ceiling lights’, all tested at the same distances. Note that this distance is measured between the base of the sensor and the ceiling light. In reality it should be decreased by 3.5 cm which is the height of the measurement cylinder and increased by 0.5 cm which is the dimension of the spacers that lift the ceiling light.
In total the three measurements are made at 17, 37, and 57 cm of distance. Because they’ve been done in air they will be corrected.
PAR measurement at 17 cm
This is the test setup. On the bottom is the chart and the device, and at the top is the ceiling light placed on the aluminum bars.
Here are the collected values:
And here is the corresponding chart, we came back to our classic scale in order to compare similar ceiling lights.
The first measurement has the shorter distance between sensor and ceiling light. But you can see how the light distribution is pretty concentrated. Consider that we have a base of 60×60 which is a definitely a lot for such a small ceiling light. But it’s obvious that the PAR quickly decrease on all the sides.
PAR measurement at 37 cm
This is the test setup. On the bottom is the chart and the device, and at the top is the ceiling light placed on the aluminum bars.
Here are the collected values:
And here is the corresponding chart.
With more space between ceiling light and sensor, there is a decrease in the difference between PAR in the middle and on the sides. The light spreads, the difference between the middle and the sides is of a distributed light lamp, and the central value decreases from 1908 to 462 μmol m-2 s-1.
PAR measurement at 57 cm
This is the test setup. On the bottom is the chart and the device, and at the top is the ceiling light placed on the aluminum bars.Even visually the illuminated area is wider, so the specific power per cm decreases.
Here are the collected values:
And here is the corresponding chart.
Increasing the space between ceiling light and sensor even more continues to lessen the difference between PAR in the middle and on the sides. We have more uniformity, as expected, but the final power decreases a lot. The light spreads, while the central value decreases from 1908 to 462 to 197 μmol m-2 s-1.
It sticks out that the coverage is uniform.
The PAR in the middle in the different configurations
Let’s continue with our technical measurements. We can see how, in a chart, the PAR collected in the middle decrease in the three different distances of the tests.
Energy variation of the AI Hydra 32 HD depending on the distance
This is the most significant and most comparable data. The energy variation. We calculated the volumes of the three surfaces previously seen. It’s obvious that moving away from the ceiling light the PAR decrease, but the light illuminates a wider space. In this way you can consider all the light energy contained in the 60×60 cm area subtended by the ceiling light. And the three values 560,185, 563,232 and 462,614 assume a different connotation compared to the values in the middle. While the first decrease because of the increasing of the distances, the subtended area, that is the energy, decreases less, because the main part of the lighting is in the middle.
In fact, looking at the values of the three curves you can see that at the sides there is more light at 37 cm than at 17 cm.
Values per channel in the middle in the three distances
We also measured the values per each channel, but only in the middle, in order to give you an idea of the contribution of different channels on PAR produced.
Let’s take a look at the measured values:
| Distance = 17 cm | Distance = 37 cm | Distance = 57 cm | |
| Channel 1 | 97 μmol m-2 s-1 | 30 μmol m-2 s-1 | 13 μmol m-2 s-1 |
| Channel 2 | 92 μmol m-2 s-1 | 31 μmol m-2 s-1 | 14 μmol m-2 s-1 |
| Channel 3 | 595 μmol m-2 s-1 | 144 μmol m-2 s-1 | 61 μmol m-2 s-1 |
| Channel 4 | 473 μmol m-2 s-1 | 110 μmol m-2 s-1 | 48 μmol m-2 s-1 |
| Channel 5 | 53 μmol m-2 s-1 | 11 μmol m-2 s-1 | 5 μmol m-2 s-1 |
| Channel 6 | 110 μmol m-2 s-1 | 24 μmol m-2 s-1 | 11 μmol m-2 s-1 |
| Channel 7 | 11 μmol m-2 s-1 | 3 μmol m-2 s-1 | 2 μmol m-2 s-1 |
| Channel 8 | 518 μmol m-2 s-1 | 120 μmol m-2 s-1 | 52 μmol m-2 s-1 |
There are three channels that are mainly responsible for PAR emission of this ceiling light: Royal Blue, Blue, and Warm White. In total, from 17 cm, they constitute the first 1586 μmol m-2 s-1, and the other 5 only 363 μmol m-2 s-1 . That’s 81%! So if you decrease green and red you wouldn’t have this great result.
The ceiling lights by AquaIllumination are distributed in Italy by ReefLine, and come with a good warranty. [Translated by Agnese Poggi]
Thanks to Reefline for providing us with this ceiling light, we did our tests on the new Aquaillumination Hydra 32 HD in the DaniReef Lab, analyzed the PAR, and created the relative distribution curves. Let’s see what we found.
The Hydra 32 HD is a new ceiling light that just came out on the market. It’s the sister of the older Hydra 26 HD, which has been very well-received over the past years. It is used in aquariums from nanoreefs to big tanks and more. So we had to have it in our hands and do our tests.
Technical characteristics of the Aquaillumination Hydra 32
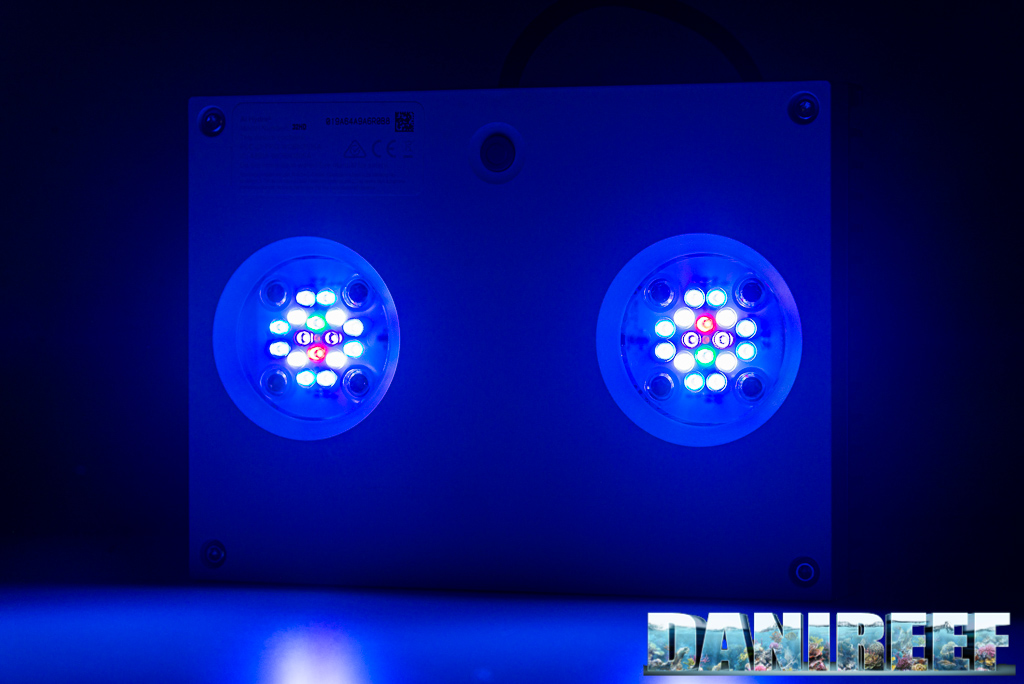
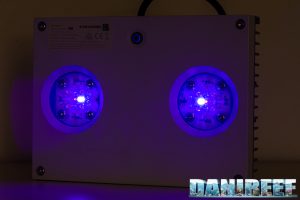
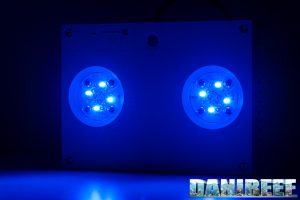
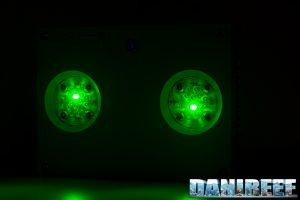
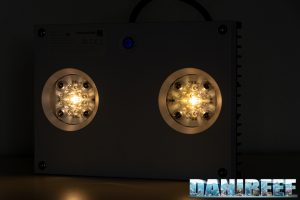
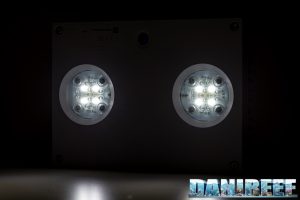
The LEDs come in 7 different colorations and are divided in 7 channels, plus a couple of LEDs for the moonlight simulation. So in total we have a couple of clusters of 14 LEDs plus the 2 moonlight LEDs.
The LEDs are divided in this way:
- 2 UV LED;
- 2 purple LED;
- 8 royal blue LED;
- 8 blue LED;
- 2 green LED;
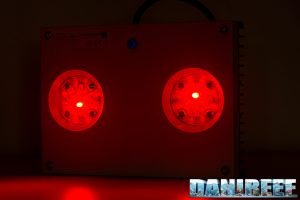
- 2 deep red LED;
- 8 warm white LED;
- 2 moonlight LED.
The other declared characteristics are:
- Power: 90 w
- Dimensions: 13,7×18,5×3,6(h) cm
- Selling price: 429,90 euro vat included ($505 USD)
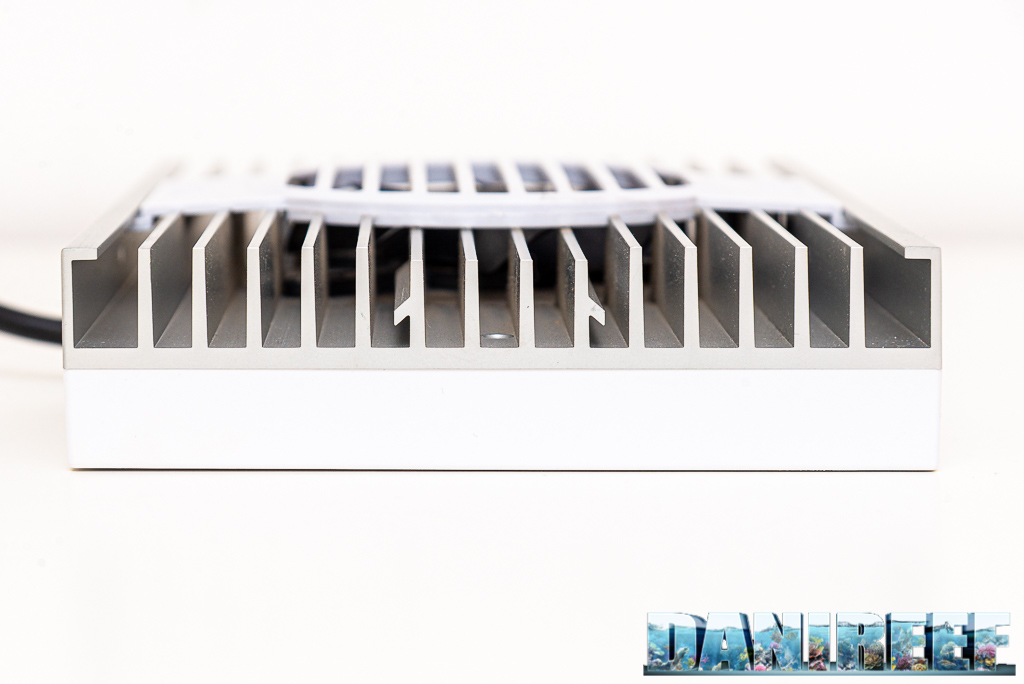
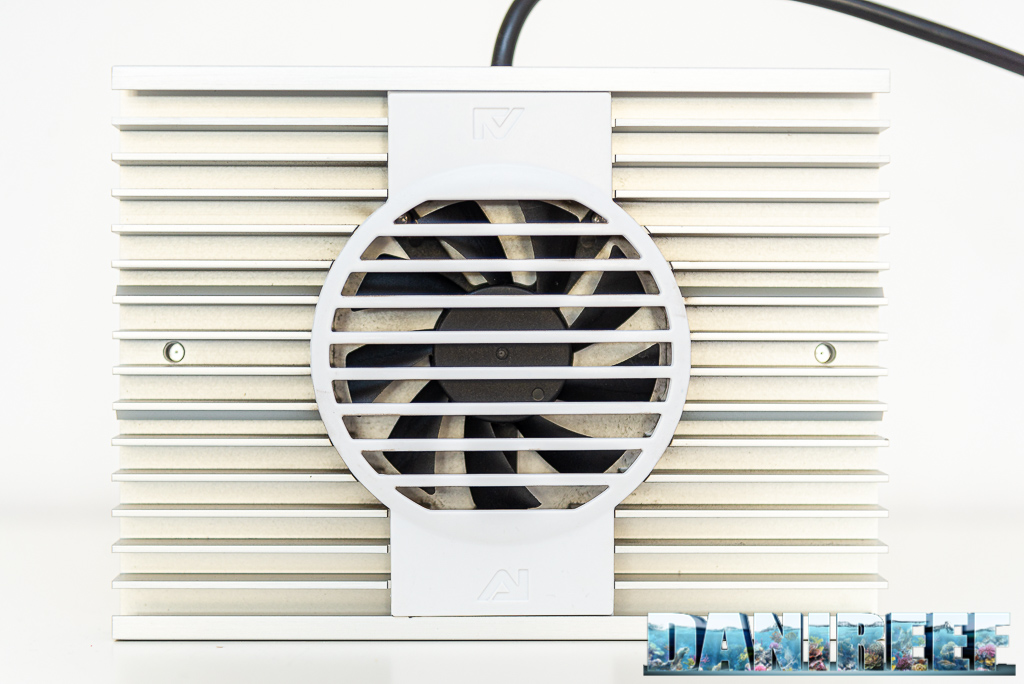
Construction
The ceiling light is flawless and the aluminium of the heatsink is very well done. The power button is now located under the ceiling light, making it easy to reach. The software is intuitive, simple, and powerful, and it connects by Bluetooth. 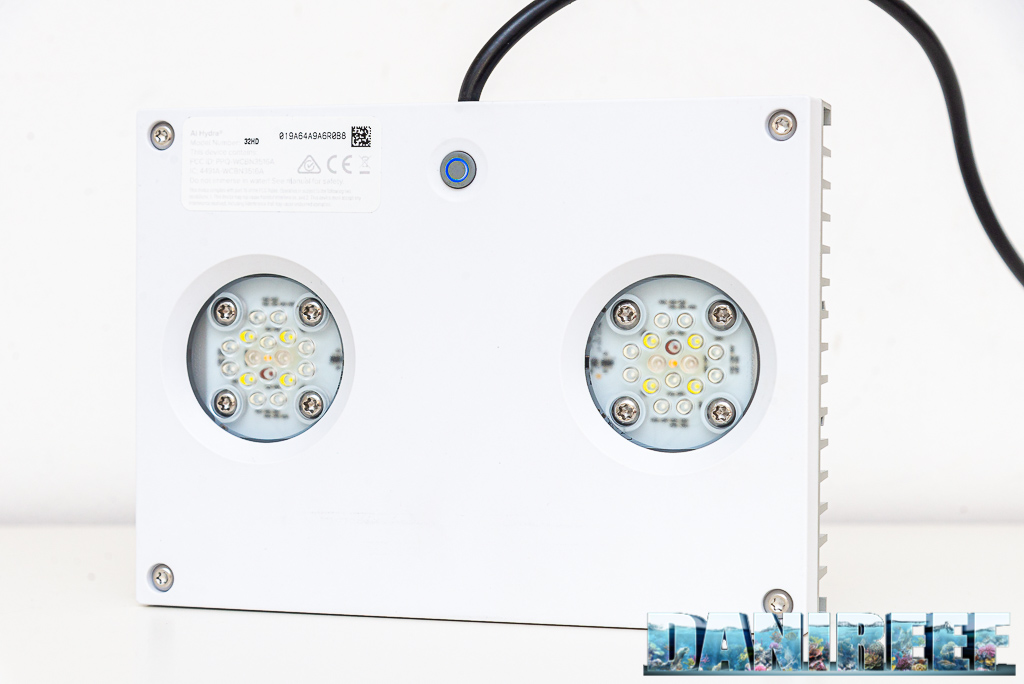
The Programming
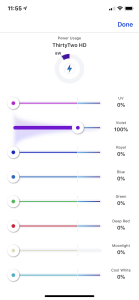
The ceiling light can be controlled by the Mobius app, for Apple or Android, and used by Bluetooth. Based on my experience, I prefer this solution over WiFi, because you have less issues with configuration and connection. The software is powerful and direct. Once launched, the app will ask you to activate Bluetooth, then you can reach the ceiling light. In a few minutes everything is at your fingertips. The ceiling light can be configured for 7 channels, plus the moonlight. 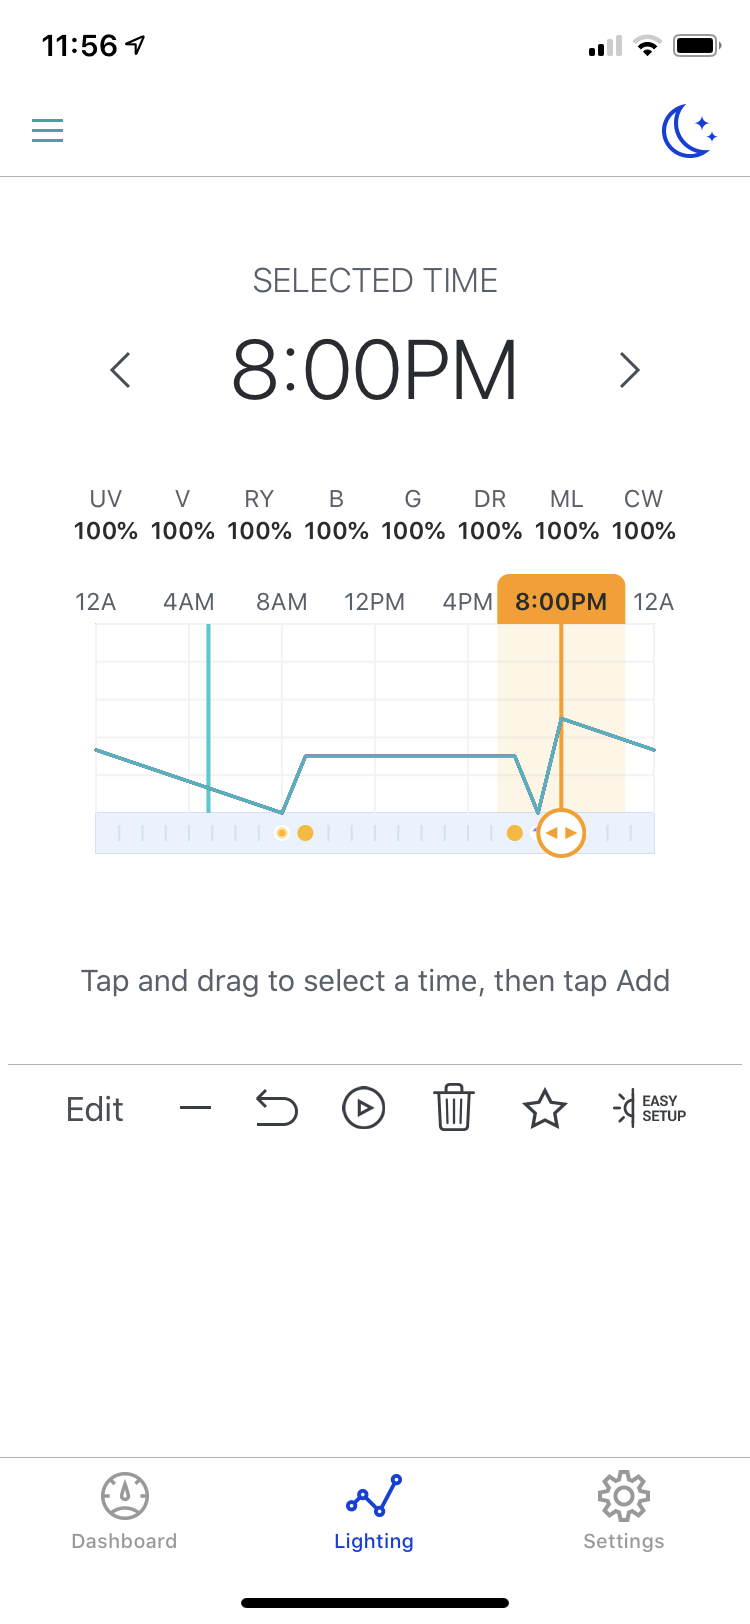
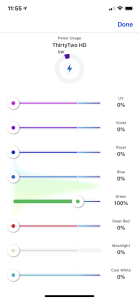
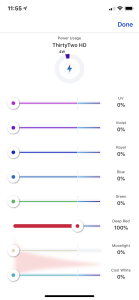
Pictured above is the menu for programming the Hydra 32 (as it appears on iPhone), where you can set the various intensities at every hour you want. It’s also possible to set the ceiling light manually to do a few tests and play around, as we did. 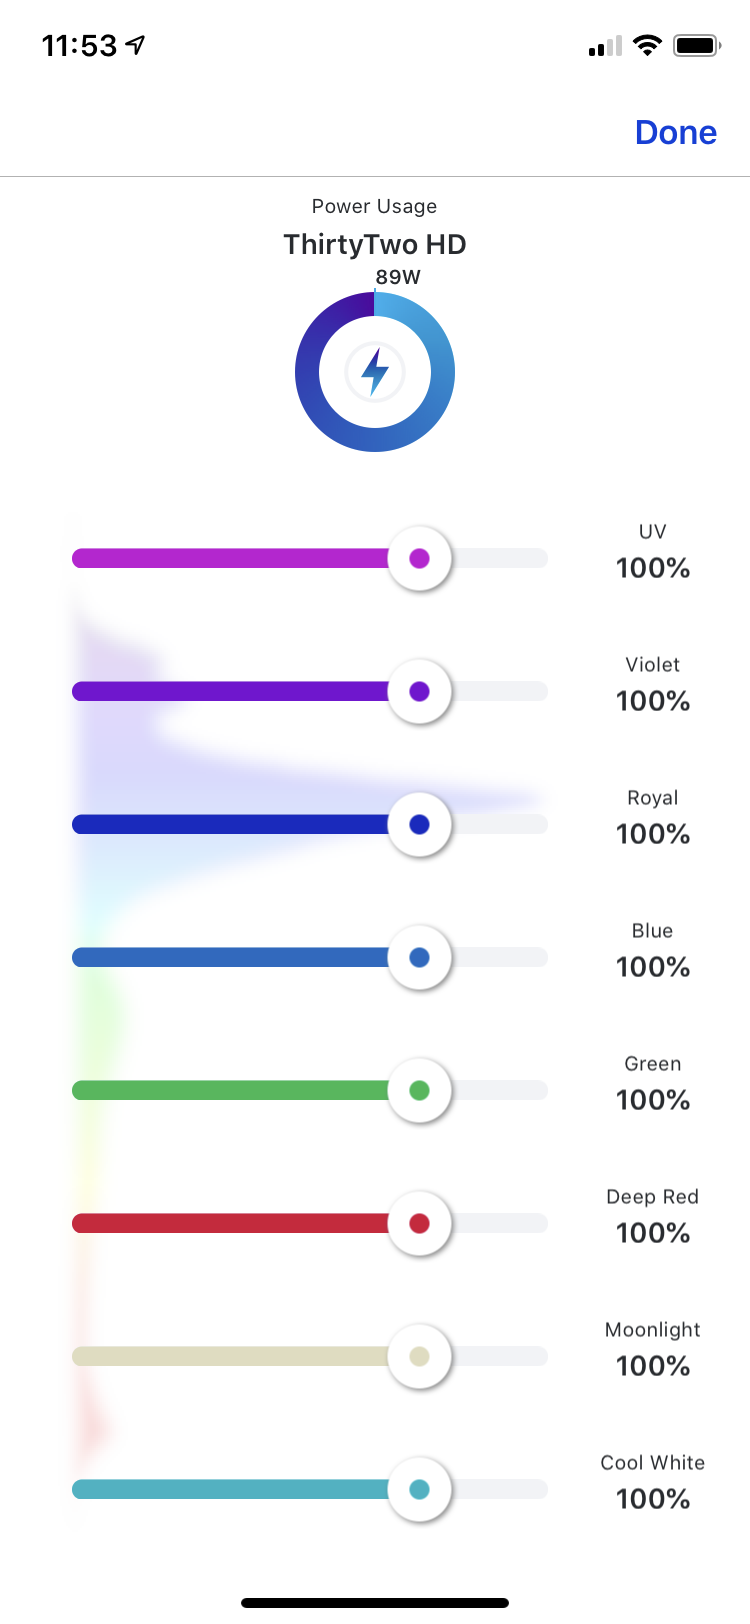
Notice that the app will show you the absorbed power, and then you can see the resulting light spectrum. One of the best features of the HD series from AquaIllumination is that it can go over the 100% mark on each channel when the other channels are unused.
AI created a spectrum that should be perfect for their plans; they also added a power supply designed specifically for the spectrum and power. Inside that power it’s possible to balance the channels, increasing one part and decreasing the other. A feature that I like very much.
There’s no delay between giving a command on the smartphone and the resulting modification of the ceiling light’s parameters in real time. Super fast.
Channel 1: UV
Channel 2: Purple
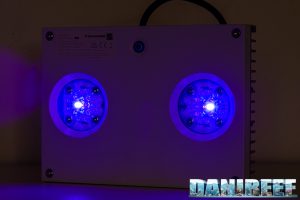
Channel 3: Royal Blue
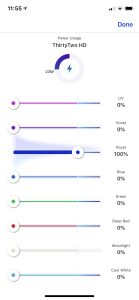
Channel 4: Blue
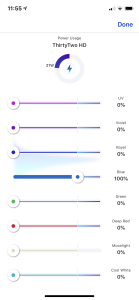
Channel 5: Green
Channel 6: Deep Red
Channel 7: Moonlight
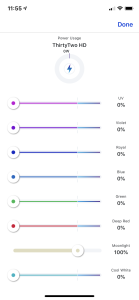
Channel 8: Warm White
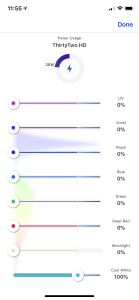
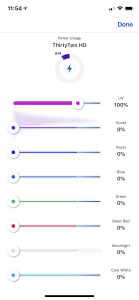
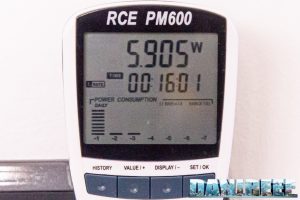
The consumption values are practically identical to the measured ones, except for the moonlight channel.
How to value these numbers in aquarium?
This is a good question. At first we thought that we could transport these values to the aquarium tout-court. We filled the aquarium, insert the probe and redone the measurements. Basically, while at 20 cm the result is practically the same, as we progressed, thanks to the glass and the water itself reflecting the light, we found even the double of the values measured in air. Obviously this isn’t a detail that can be standardized, so we think that our method of calculation is the most correct, and the best for the comparison of coverages of different ceiling lights.
Power Consumption
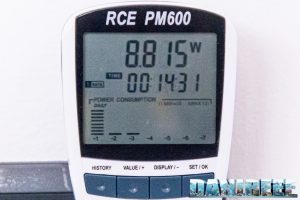
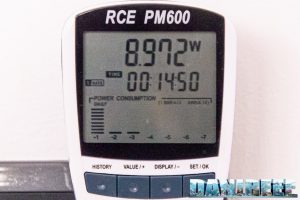
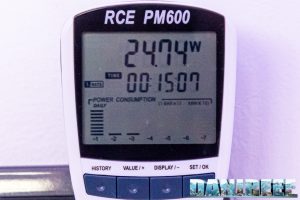
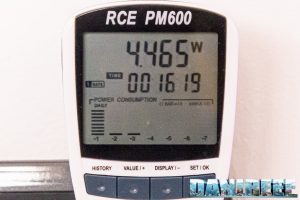
The measurement of the consumption was made possible thanks to the useful RCE PM600 that can also measure the Cos(fi) (or power factor). The result is already given in watts.
Above is the maximum power and below is the Cos(fi).
The calculation of the absorbed current, that is the power, is as follows:
AquaIllumination Hydra 32HD ceiling light: 90.5 watt. Considering that from 17 cm the ceiling light has at the middle 1908 μmol m-2 s-1, we can guess that it will have a peak value of 21.08 μmol m-2 s-1 w-1 (PAR per watt).
The power consumption is in line with what is declared and indicated by the app. But we are more interested in the PAR value than the similarity with the declared data, because we want to know what this ceiling light allows us to breed.
The comparison with other ceiling lights on the market
Recently we started to use the new Apogee’s Quantum Meter MQ-510. For this we can’t completely compare the data of other ceiling lights because until recently, we used the Seneye probe.
But considering the first ceiling lights we managed to test we can do an interesting comparison about their produced energy:
| Energy | Cost | Consumption | Energy/€ | Energy/w | |
| AI Hydra 32 HD at 17 cm | 560.185 | 430 | 90,50 | 1.303 | 6.190 |
| AI Hydra 32 HD at 37 cm | 563.232 | 430 | 90,50 | 1.310 | 6.224 |
| AI Hydra 32 HD at 57 cm | 462.614 | 430 | 90,50 | 1.076 | 5.112 |
| Aqamai LRM at 17 cm | 642.649 | 465 | 90,88 | 1.382 | 7.071 |
| Aqamai LRM at 37 cm | 721.676 | 465 | 90,88 | 1.552 | 7.941 |
| Aqamai LRM at 57 cm | 616.470 | 465 | 90,88 | 1.326 | 6.783 |
| Cetus 2 at 17 cm | 409.993 | 215 | 60,68 | 1.906 | 6.756 |
| Cetus 2 at 37 cm | 290.866 | 215 | 60,68 | 1.353 | 4.793 |
| Cetus 2 at 57 cm | 173.651 | 215 | 60,68 | 807 | 2.861 |
| Philips CoralCare at 17 cm | 1.858.572 | 749 | 190,50 | 2.481 | 9.756 |
| Philips CoralCare at 37 cm | 1.340.533 | 749 | 190,50 | 1.790 | 7.037 |
| Philips CoralCare at 57 cm | 933.246 | 749 | 190,50 | 1.246 | 4.899 |
The energy per watt is lower than the similar Aqamai LRM; we think it is because of the additional LED channel (not counting the moonlight channel). So, the more the LED that are white, the higher the efficiency, the more you consider the sides, especially UV and Purple, the lower the efficiency. It’s the price you pay for a wider spectrum.
| Ceiling light | PAR | Watt | Price | PAR/watt | euro per watt | euro per PAR |
| GNC 466 | 696 (Seneye) | 120 | 1.400 euro | 5,8 spread | 11,7 | 2,01 |
| Orphek Atlantik V4 | 1.515 (Apogee) | 226 | 1.099 euro | 6,7 spread | 4,9 | 0,73 |
| Philips CoralCare 2019 | 2.088 (Apogee) | 190 | 749 euro | 11 spread | 3,9 | 0,35 |
| Maxspect Ethereal | 689 (Seneye) | 130 | 500 euro | 5,3 semi-spread | 3,8 | 0,72 |
| Barra Led Askoll Pure Marine | 237 (Apogee) | 28 | n.d. | 8,4 | ||
| Zetlight UFO ZE-8000 | 791 (Seneye) | 91,5 | 500 euro | 8,6 cluster | 5,5 | 0,63 |
| Aqamai LRM | 2.285 (Apogee) | 90,88 | 465 euro | 25,14 double cluster | 5,1 | 0,20 |
| AI Hydra 32 HD | 1.908 (Apogee) | 90.50 | 430 euro | 21,08 double cluster | 4,75 | 0,23 |
| Cetus 2 | 746 (Apogee) | 60,68 | 215 | 12,29 cluster | 3,5 | 0,28 |
The AI Hydra 32 HD has a very low value of euro per PAR, passed only by the Cetus 2. The efficiency is the highest. It’s one of the most efficient ceiling lights, and for 430 euro it’s hard to ask for more.
Cost
The AI Hydra 32 HD ceiling lights cost 429,90 euro. ($505 USD)
The absorbed power is 90.50 watts, so the relationship euro per watt is 4,75 euro ($5.59 USD) for each watt. In order to do a comparison with the other ceiling lights you can refer to this chart:
| Ceiling light | Price | Consumption | Relationship euro/watt | |
| Cetus 2 | 215 euro | 60,68 watt | 3,5 euro per watt | |
| Philips Coralcare 2019 | 749 euro | 190 watt | 3,9 euro per watt | |
| Maxspect Ethereal | 500 euro | 126 watt | 4,0 euro per watt | |
| Radion XR30w G2 PRO | 790 euro | 170 watt | 4,7 euro per watt | |
| AI Hydra 32 HD | 430 euro | 90,5 watt | 4,75 euro per watt | |
| Radion XR30w G4 PRO | 915 euro | 190 watt | 4,84 euro per watt | |
| OceanLed Sunrise 600 | 870 euro | 180 watt | 4,8 euro per watt | |
| Orphek Atlantik V4 | 1099 euro | 226 watt | 4,9 euro per watt | |
| Radion XR30w G2 | 690 euro | 140 watt | 4,9 euro per watt | |
| Radion XR30w G4 | 760 euro | 150 watt | 5,1 euro per watt | |
| Aqamai LRM | 465 euro | 87,5 watt | 5,1 euro per watt | |
| Zetlight UFO ZE-8000 | 500 euro | 91,5 watt | 5,5 euro per watt | |
| CEAB Slide & Led | 2.700 euro | 275 watt | 9,8 euro per watt | |
| Sicce GNC 466 | 1.592 euro | 120 watt | 13,3 euro per watt |
The ceiling light is very well built, heavy and solid. Easy to be programmed, with a very fast and direct program. The efficiency is very high even if it lacks a bit of power compared to other ceiling lights. The perfect coverage is about 30-40 cm of distance, then it decreases. The values are perfect for nanoreefs and tanks up to 60 cm of width, both for easy SPS and other animals. The global energy expressed is very good and linear. The dispersion on the sides in minimal within 60 cm.
Questions and comments, as always, are welcomed.
Our new method DaniReef LAB for PAR measurement of the AquaIllumination Hydra 32 HD
Backstory: (this paragraph is the same for all the ceiling lights tested with our DaniReef method in order to explain the working method) During the long nights spent on our forum (here) we always wondered how could we compare PAR from different ceiling lights. Even though we had the perfect device, the Quantum Meter MQ-510 di Apogee, we always referred only to the value measured at the center at 20 cm of distance, more or less.
The Quantum Meter MQ-510 measures the PAR, expressed in PFFD that is photosynthetic photon flux density in μmol m-2 s-1. This device is calibrated to work underwater, so if it’s in air the measured value has to be divided by 1.32 – the dive factor. We have to do the conversion. The values you’re going to see are correct.
We decided to make a square base of 70×70 cm, we set 17 fiducial points where we placed the Quantum Meter MQ-510 sensor and we also made 3 lifts of 20, 40, and 60 cm for the ceiling light, in order to have the same distance from the sensor. This will allow us to create the curves which can be compared to other ceiling lights’, all tested at the same distances. Note that this distance is measured between the base of the sensor and the ceiling light. In reality it should be decreased by 3.5 cm which is the height of the measurement cylinder and increased by 0.5 cm which is the dimension of the spacers that lift the ceiling light.
In total the three measurements are made at 17, 37, and 57 cm of distance. Because they’ve been done in air they will be corrected.
PAR measurement at 17 cm
This is the test setup. On the bottom is the chart and the device, and at the top is the ceiling light placed on the aluminum bars.
Here are the collected values:
And here is the corresponding chart, we came back to our classic scale in order to compare similar ceiling lights.
The first measurement has the shorter distance between sensor and ceiling light. But you can see how the light distribution is pretty concentrated. Consider that we have a base of 60×60 which is a definitely a lot for such a small ceiling light. But it’s obvious that the PAR quickly decrease on all the sides.
PAR measurement at 37 cm
This is the test setup. On the bottom is the chart and the device, and at the top is the ceiling light placed on the aluminum bars.
Here are the collected values:
And here is the corresponding chart.
With more space between ceiling light and sensor, there is a decrease in the difference between PAR in the middle and on the sides. The light spreads, the difference between the middle and the sides is of a distributed light lamp, and the central value decreases from 1908 to 462 μmol m-2 s-1.
PAR measurement at 57 cm
This is the test setup. On the bottom is the chart and the device, and at the top is the ceiling light placed on the aluminum bars.Even visually the illuminated area is wider, so the specific power per cm decreases.
Here are the collected values:
And here is the corresponding chart.
Increasing the space between ceiling light and sensor even more continues to lessen the difference between PAR in the middle and on the sides. We have more uniformity, as expected, but the final power decreases a lot. The light spreads, while the central value decreases from 1908 to 462 to 197 μmol m-2 s-1.
It sticks out that the coverage is uniform.
The PAR in the middle in the different configurations
Let’s continue with our technical measurements. We can see how, in a chart, the PAR collected in the middle decrease in the three different distances of the tests.
Energy variation of the AI Hydra 32 HD depending on the distance
This is the most significant and most comparable data. The energy variation. We calculated the volumes of the three surfaces previously seen. It’s obvious that moving away from the ceiling light the PAR decrease, but the light illuminates a wider space. In this way you can consider all the light energy contained in the 60×60 cm area subtended by the ceiling light. And the three values 560,185, 563,232 and 462,614 assume a different connotation compared to the values in the middle. While the first decrease because of the increasing of the distances, the subtended area, that is the energy, decreases less, because the main part of the lighting is in the middle.
In fact, looking at the values of the three curves you can see that at the sides there is more light at 37 cm than at 17 cm.
Values per channel in the middle in the three distances
We also measured the values per each channel, but only in the middle, in order to give you an idea of the contribution of different channels on PAR produced.
Let’s take a look at the measured values:
| Distance = 17 cm | Distance = 37 cm | Distance = 57 cm | |
| Channel 1 | 97 μmol m-2 s-1 | 30 μmol m-2 s-1 | 13 μmol m-2 s-1 |
| Channel 2 | 92 μmol m-2 s-1 | 31 μmol m-2 s-1 | 14 μmol m-2 s-1 |
| Channel 3 | 595 μmol m-2 s-1 | 144 μmol m-2 s-1 | 61 μmol m-2 s-1 |
| Channel 4 | 473 μmol m-2 s-1 | 110 μmol m-2 s-1 | 48 μmol m-2 s-1 |
| Channel 5 | 53 μmol m-2 s-1 | 11 μmol m-2 s-1 | 5 μmol m-2 s-1 |
| Channel 6 | 110 μmol m-2 s-1 | 24 μmol m-2 s-1 | 11 μmol m-2 s-1 |
| Channel 7 | 11 μmol m-2 s-1 | 3 μmol m-2 s-1 | 2 μmol m-2 s-1 |
| Channel 8 | 518 μmol m-2 s-1 | 120 μmol m-2 s-1 | 52 μmol m-2 s-1 |
There are three channels that are mainly responsible for PAR emission of this ceiling light: Royal Blue, Blue, and Warm White. In total, from 17 cm, they constitute the first 1586 μmol m-2 s-1, and the other 5 only 363 μmol m-2 s-1 . That’s 81%! So if you decrease green and red you wouldn’t have this great result.
The ceiling lights by AquaIllumination are distributed in Italy by ReefLine, and come with a good warranty. [Translated by Agnese Poggi]


0 Comments