

This is the concluding topic and the penultimate editorial discussing electromagnetic theory, how we see, natural light and its occurrence in nature, and various ways of quantifying and administering the most efficacious wavelengths that activate the photoreactive pigments of corals and their symbionts. The kind of illumination is decisive in SPS mariculture insofar as manmade sources are far less intense, cannot penetrate as deep, and technology has yet to provide a cost-effective solution that accurately mimics the tropical sun.
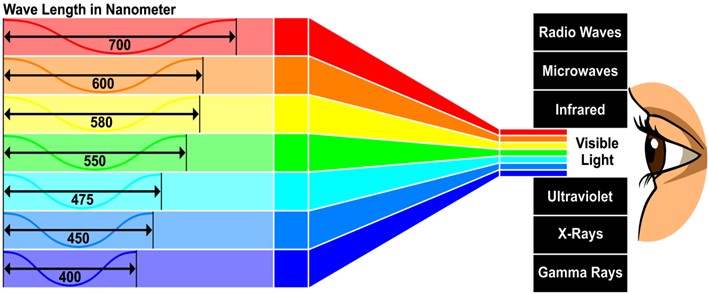
Fig 1. A representation of the electromagnetic (EM) spectrum and a minor component considered visible light where each color manifests as a range of wavelengths expressed in nanometers (nm) and frequencies (waves per second; hertz; Hz). Frequency- and wavelength-diminished yellows, oranges, and reds contrast with more frequent and energetic, shorter ultraviolets, blues, and greens, while heat-transmitting infrared (IR) remains potentially harmful.
Visible light is a modest part of the electromagnetic (EM) spectrum that comprises massless particles called photons that travel in waves of specific length measured in nanometers (nm) which extends ostensibly from 400 to 700 nm (~1015 to ~1013 Hz). Shorter wavelength higher energy ultraviolets (UVs), blues, and greens occur more frequently per second (Hz) while yellows, oranges, and reds are longer, of lower energy, and occur less often. Infrared (IR) is a heat-transmitting invisible form of potentially injurious radiation (Fig 1.).
Colorless photons stimulate red (long), green (medium), and blue (short) cone receptors in the retina of our eyes that generate unique signatures corresponding to each wavelength, which travel via the optic nerve to the brain that assigns each color (Fig 3.). Interpersonal disparities occur during this process and people with color deficiency see them differently. It became necessary in the early 20th century to standardize hues for potentially dangerous machinery and traffic signals. So the International Committee on Illuminance (Commission Internationale d’Éclairage; CIE) created a color map called the chromaticity diagram that corresponds to what most humans see (Fig 2.; Blackwell 2008).
CIE initially used the light from red (r; 700 nm), green (g; 546.1 nm), and blue (b; 435.8 nm) lamps to match spectral colors where each lamp’s contribution was assigned a numerical value which yielded data for r, g, and b called the tristimulus values. However, the entire spectrum could not be matched with three lamps because the r lamp had to administer light to some components before a mixture of g and b could recreate the color, where r’s contribution was subtracted. The tristimulus values thus became negative between 440 to 545 nm (Blackwell 2008).

Fig 2. The 2D chromaticity diagram devised in France by the international committee on illuminance (Commission Internationale d’Éclairage; CIE) in 1931 is commensurate with the colors that most people see, insofar as colorless photons are received by red, blue, and green cone receptors in the retinal lining which send pulses via the optic nerve to the brain where they are interpreted.

Fig 3. Cone absorption spectra illustrating three peak wavelengths of short (S-cone; blue; 437 nm), medium (M-cone; green; 533 nm) and long (L-cone; red; 664 nm). Includes the twilight-sensitive rod receptor absorption spectrum. Notwithstanding maximum absorbance (ʎMAX), considerable overlap results in each wavelength eliciting a distinctive response. Adapted from DeMarco et al. 1992 and Lynch and Corbett 2015.
Vectors have more than one dimension like color and direction where CIE plotted the positive tristimulus values as vectors with magnitudes ranging from 0 to 1 on an x, y, z 3D map of color space, but the graphs lacked negative data. Ingenious CIE mathematicians delineated the tristimulus statistics to yield the entirely positive r, g, and b spectral sensitivity values. The x, y, and z axes of color space with maximum values of 1 became the vertices of an equilateral triangle called the unit plane which traced out an arc called the spectral locus when intersected by the gamut of spectral sensitivity vectors. The unit plane was thus transformed into a 3D chromaticity diagram which was later converted to 2D for convenience (Fig 2.; Fig 4.; Blackwell 2008).
400 to 700 nm are represented on the exterior of the arc where its bottom comprises non-spectral colors called the purple line (Fig 2.). A blend of all spectral colors creates achromatic solar white where equal energy white is a vital reference point where x = 0.333 and y = 0.333. The diagram is predominantly green, because our g or medium cone receptors are twice as abundant where only a quarter are r and b. Our eyes are thus more sensitive to mean spectral irradiance (Blackwell 2008) which enhances our ability to focus, yet g is reflected by several chlorophylls. High Lux sources comprising much 560 nm green/yellow have an elevated color rendering index (CRI) which ranges from 1 to 100 and is both quantitative and qualitative, since higher values better illuminate colors and enhance sharpness. Green emissions with CRIs of more than 95 are thus appropriate for eutrophic fish-only systems because they poorly nourish several phototrophs while they optimize acuity and color discernment.
-
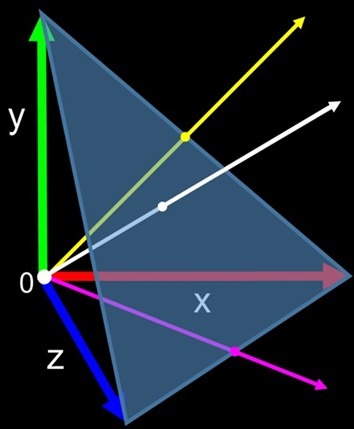
- Fig 4. Left – the unit plane with labelled axes illustrating the vectors of yellow, magenta, and white.
-
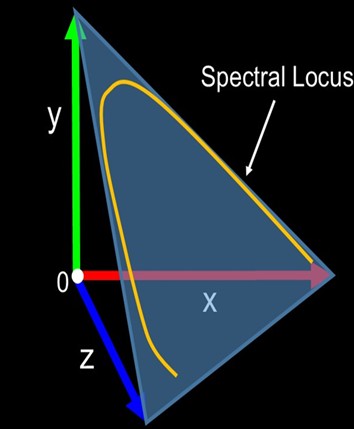
- Right – an arc called the spectral locus appears when the vectors of the delineated tristimulus values are plotted, which transforms the unit plane into a 3D chromaticity diagram. Not to scale and adapted from Blackwell 2008 and Nguyen 2013.
We interpret an extensive range of colored light as white thanks to a phenomenon called color constancy (Blackwell 2008) which is somewhat explained by “blackbody” radiation and the kelvin correlated color temperature (CCT). The kelvin (K) scale is used in science because all atomic and molecular movement putatively ceases at “absolute zero” or 0K (-273.15oC). The magnitude of a degree Celsius (oC) and kelvin (K) are the same, but kelvin values are 273 degrees greater so 100oC is 373K.
Thermally equilibrated “blackbodies” absorb and radiate all electromagnetic (EM) frequencies equally where CCTs expressed in kelvin refer to colors. Most kelvin assigned spectra approximate to white (Blackwell 2008) where the energy of each component wavelength is described using the term spectral power distribution (SPD).
Yellows and oranges correspond to lower temperatures compared with the blue parts of flames or “white” heat, therefore “warm whites” range from 2,500K to 3,500K, whereas “cool white” daylight spectra range from 6,500 to 7,000K (Fig 5.). Moreover, bluer reef lighting lies between 10,000 and 20,000K insofar as its competency for penetrating seawater ensures mesophotic zone corals are accustomed to shorter wavelength blue/green.
A maximum photoperiod of eight hours must be adopted when exploiting metal halide lamps where merely six hours of intense irradiance penetrates seawater in the wild. 6,500K metal halide lamps emit radiation somewhat analogous to the tropical sun which was considered the most valuable a decade ago which is mostly true today. However, a study concluded that 6,500K metal halide lamps from acclaimed Iwasaki® and Ushio® did not recreate the spectral emissions of natural light, despite numerous compelling aquarist endorsements. Hence corals likely adapt to optimize the efficacy of photons received (Joshi 2005).
Some hermatypes do not perform well under LEDs. The cover glass of 70 and 150W or larger metal halide lamps must be suspended no closer than 8” (20.3 centimeters; cm) and 12” (30.5 cm) from the surface respectively, otherwise IR elicits temperature fluctuations and anomalies. IR can heat corals, substrate, and substratum while water temperatures remain stable, and thermal stress can bleach.

Fig 5. The kelvin correlated color temperature (CCT) of a range of colors that we perceive as white (Blackwell 2008). Higher reef appropriate CCTs are shorter wavelength blues because they lack “warmer” oranges and yellows.
Many of the photoreactive biochemicals of corals and their dinoflagellate “algal” partners (zooxanthellae) absorb one wavelength of light and fluoresce another. Thanks to a phenomenon called Stokes shift, the refracted or emitted light is always of lower energy and a longer wavelength (Edinburgh Instruments 2019). Zooxanthellate corals in deep water may thus benefit by utilizing an arsenal of photoreactive pigments to convert depth-penetrating short wavelength blues to deficient lower frequencies from the red end of the spectrum (Tyree 2000; Lyndby et al. 2016; Riddle 2016; Bollati et al. 2017; Smith et al. 2017). Yet these biochemicals are photoprotective in shallow water insofar as florescence quenches/dissipates surplus excitation (Gittins et al. 2015; Lyndby et al. 2016; Riddle 2016; Bollati et al. 2017; Smith et al. 2017).
Zooxanthellae exploit chlorophylls a, c2, and peridinin (Bollati et al. 2017; Smith et al. 2017) where a absorbs between 620 and 680, 430 and 450, and 460 and 470 nm and emits from 678 to 735 nm (Kuhl et al. 1995). The carotenoids peridinin, diatoxanthin, b-carotene, and diadinoxanthin absorb and entirely expend from 478 to 500, 449 to 475, and 460 to 490 nm respectively (Roth 2014). Xanthophyll cycles may be photoprotective or they may support homeostasis (Ambarsari et al. 1997). Secondary carotenoid absorption occurs from 450 to 550 with minor components between 480 and 490 and 540 and 550 nm. Chlorophyll c absorbs 625 to 640 and 450 to 470 with a discrete band at 590 nm (Kuhl et al. 1995), while c2 emits at 644 (Fig 7.; Kuhl et al. 1995; Roth 2014).
A family of green-to-red fluorescent proteins (GFPs) were discovered in several Scleractinia, where 400 nm UVA induced what appeared to be a protective mechanism whereby the polypeptide backbone was catalytically cleaved, which instigated color disparities and perturbed electron excitation and distribution. Such GFP absorption maxima (ʎMAX) ranged from 504 to 582 nm (Oswald et al. 2007). Red colonies manufactured much of the switchable green-to-red fluorescent protein, whereas green colonies were abundant in a cyanobacterial GFP and generated low concentrations of red. GFPs from a range of Anthozoa absorbed 506 and emitted 516 nm where 400 nm also transformed their emissions from green-to-red. All such proteins have near-identical absorption and emission spectra yet their role remains enigmatic (Oswald et al. 2007) and further investigations appear lacking (Alieva et al. 2008). Energy can neither be created nor destroyed yet it can be converted to a power-dissipating form, where noisy mechanical bearings expend more horsepower than silent.

Fig 6. The 1931 CIE chromaticity diagram superimposed with the “blackbody” locus CCT scale. We see all colors above 2,856K as white light, whereas equal energy white (E) is located between 6,000 and 10,000K.
Protective xanthophylls and the carotenoid peridinin absorb from 440 to 490 nm and thus contend for blue/green light with chlorophylls a and c2. 365 and 400 nm UVA and 420 nm blue profoundly stimulate photosynthesis but xanthophylls do not protect the holobiont from harmful 631 to 657 nm red (Riddle 2014a).
Carotenes are orange/yellow and absorb blue/violet light (Hill et al. 2012). Dinoflagellate antioxidant β-carotene may harvest light because concentrations amassed in photo- and heat-stressed corals. Surplus irradiance triggers pH disparities that dissipate energy through the conversion of the xanthophyll carotenoid diadinoxanthin to diatoxanthin which reverts in darkness. Xanthophylls predominantly absorb between 450 and 490 nm yet may utilize some near UV, while dinoxanthin may be a xanthophyll yet its function remains unclear (Riddle 2014a).
Coral skeletons poorly reflect red but ricochet blue and violet which pass through symbionts twice (Riddle 2014a). Phaeophytin is integral to the photosynthetic electron transport chain that transfers reduction potential between photosystem II (PSII) and PSI, where it and zooxanthellae’s chlorophylls were diminished in partially dysbiotic colonies. Nevertheless, xanthophyll abundance remained unaltered throughout elevated temperatures which suggests a hitherto unrecognized role (Venn et al. 2006), whereas contrasting studies concluded thermal stress diminished β-carotene, diadinoxanthin, diatoxanthin, and peridinin (Béraud et al. 2013; Ferrier‐Pagès et al. 2016). Hydrogen peroxide (H2O2) is an antimicrobial reactive oxygen species (ROS), a useful photosynthetic intermediate, and potent bleach which may be partly responsible for pigment loss (Nielsen et al. 2018; Boilard et al. 2020; McCauley et al. 2022).
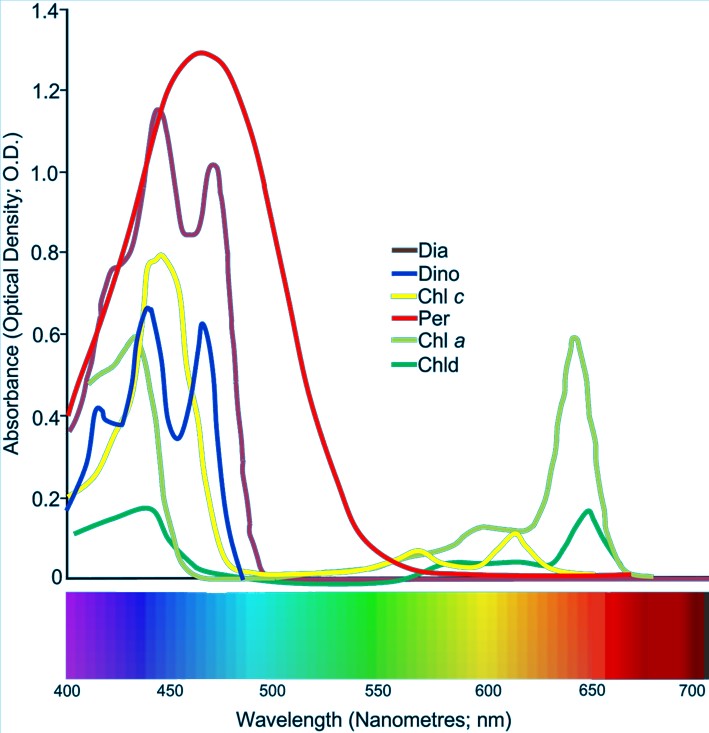
Fig 7. The absorption spectra of various types of photoreactive biochemicals found in the symbionts of Dipsastraea favus: Chl (chlorophyll); Chld (chlorophyllidae); Dia (diatoxanthin); Dino (diadinoxanthin), and Per (peridinin). Adapted from Levy et al. 2003.
Zooxanthellae’s “sunscreen” and profoundly antioxidant mycosporine-like amino acids (MAAs) protect against surplus 310 nm UVB and above which include mycosporine-2 glycine, mycosporine-glycine, mycosporine-NMA serine, mycosporine-NMA threonine, palythine serine sulphate, palythine serine, playthine, playthinol, phorphyra, and shinorine (Riddle 2004; Starcevic et al. 2010; Riddle 2014a).
Solar irradiance flux density (SIFD) is the total irradiance from the sun expressed in watts per square meter (W m-2) or watts per meter squared per nm (W m-2 nm-1). SIFD represents the entire spectrum measured using a pyranometer from 300 to 3,000 nm which includes non-visible UV and IR. PAR expresses visible radiation from 400 to 700 nm in micromoles of photons per meter squared per second (µmol m-2 s-1), where the instrumentation measures photosynthetic photon flux density (PPFD).
SIFD in W m-2 and PAR in µmol m-2 s-1 are mostly incomparable because they cannot be interconverted yet multiplying W m-2 by 4.57 yields somewhat analogous µmol m-2 s-1, although only 45 percent of insolation occurs between 400 and 700 nm; therefore, a closer estimation uses 45 percent of the conversion factor (2.1; Sager & Mc Farlane 1997).
Not all wavelengths from 400 to 700 nm are used by the known photoreactive pigments of coral holobionts, and thus the modern reef enthusiast favors an approximation of lamp emissions that energize chlorophylls known as photosynthetically useful radiation (PUR). Sensors and software detect and calculate PUR as the ratio of PUR to PAR (PUR:PAR) or as a percentage of PAR (PUR / PAR x 100). PUR thus quasi-enumerates the proportion of PAR that is used by hermatypic corals and their mutualist phototrophs (Fig 10.).
Fig 8. An author-attempt at illustrating a reliable representation of oceanic irradiance downwelling, whereas inshore turbidity may instigate a shift to green/yellow. Outcomes are impacted by water clarity and color, cloud cover and atmospheric pollution, suspended solids, season, and phytoplankton; nevertheless, it is challenging to draw conclusions from the breadth of available data (Austin & Petzold 1986; Michael et al. 2011; Depauw et al. 2012; Byun et al. 2014; Tonk et al. 2014).

Fig 9. The solar elevation and zenith angles.
The Seneye reef monitor delivers cost-effective sophisticated light analysis to the hobbyist. It would never be used in an objective study, yet it returns invaluable information.
Figure 11. features emission analyses of a double-ended (DE) 20,000K metal halide lamp and a 50/50 mix of very high output (VHO) marine white and actinic T5 fluorescent tubes some distance from the luminaire.
Comprehensive appraisals of colony PAR include sub-colony upwelling and lateral side-welling. For example, 62 from each side, 76 from beneath, and 220 µmol m-2 s-1 from above (62 x 4) + 76 + 220 = 544 µmol m-2 s-1.
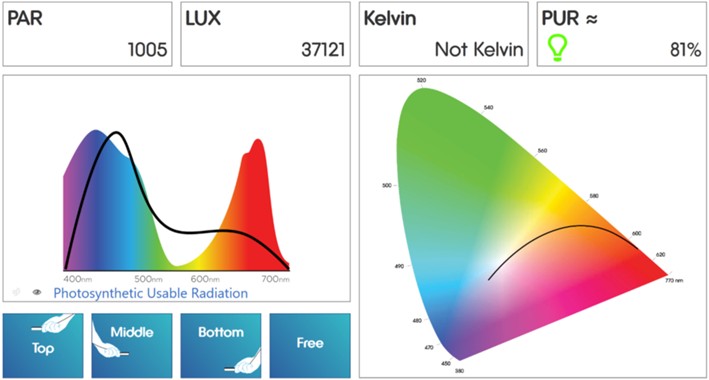
Fig 10. The Seneye reef monitor’s evaluation of the DIY LED luminaire that is fully described and illuminated in The Complete Reef Aquarist – A Conservation Manual (https://www.ebay.co.uk/itm/116390701502). Image courtesy of the Seneye reef monitor’s software ©.
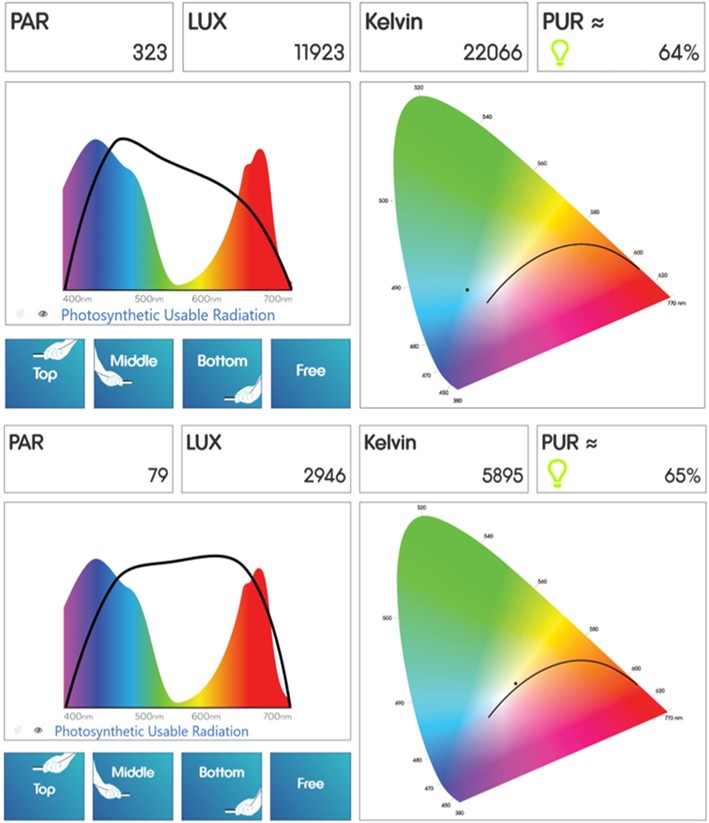
Fig 11. The Seneye reef monitor’s analyses of a double-ended (DE) 20,000K metal halide lamp (top) and a 50/50 mix of very high output (VHO) marine white and actinic T5 fluorescent tubes. Images courtesy of the Seneye reef monitor software ©.
Inordinate variables confound a consensus of natural irradiance downwelling. 750 nm IR is evident to divers several meters down, yet it is diminished at 5 m to 59 µmol m-2 s-1 (Delbeek & Sprung 2005; Depauw et al. 2012). 650 nm yellow attains an equivalent PAR at 35 m, yet 75 µmol m-2 s-1 of 550 nm green and 350 nm UVA are evident at 100 m, while 81 µmol m-2 s-1 of 450 nm blue is present at the same depth (Fig 8.; Austin & Petzold 1986). 400 to 500 nm blue/green predominates below 100 m due to the scattering and absorption of UV, IR, red, orange, and yellow (Depauw et al. 2012). A shift to deep-penetrating 500 to 550 nm green occurs inshore due to turbidity while surface PAR accounts for only 42 to 50 percent of total downwelling. Furthermore, just 40 to 50 percent of surface-penetrating photons have wavelengths between 400 and 700 nm. The euphotic zone where light-dependent organisms dwell, extends in clear water to merely 37 m on The Great Barrier Reef (GBR; Michael et al. 2011), while several symbionts utilize 350 nm UVA and above (Riddle, personal communication, cited in Neptune systems 2019).
Seawater penetration is further influenced by solar elevation, surface reflectance (albedo), atmospheric pollution, air vapor, and clouds. Solar elevation and zenith angles are inversely proportional where the latter is minimized on the equator and alters according to season and time of day (Fig 9.; https://www.timeanddate.com). Dawn and dusk zenith and solar elevation angles are such that most light is reflected, whereas surface and sunlight interplay exclude another 10 to 50 percent (MacKellar et al. 2011; Byun et al. 2014). Zenith angles between 0 to 60o result in approximately 1 to 2.3 percent exclusion, which increases sharply for every degree larger and thus all light is reflected at 87o (Joshi 2005).
Surface PARs during an eight-hour photoperiod from 8 am to 4 pm ranged from 1,700 µmol m-2 s-1 in January and February on GBR to their lowest in mid-May at merely 500 µmol m-2 s-1 (Bainbridge 2017). Cloud cover can diminish solar irradiance by 50 percent (Crisp 1997) and likewise, sunlight is attenuated by volcanic smoke in Hawaii (Riddle, personal communication, cited in Neptune Systems 2019). The sun is at its maximum elevation and ferocity in late summer on GBR, where 54, 73, and 94 percent cloud cover occurred daily at three locations (MacKellar et al. 2011).

Fig 12. Sunlight shimmering on the surface of the ocean.
Somewhat unidirectional sunlight, metal halide lamp, and LED emissions interact with surface movement to generate potent shimmer lines. These peaks and troughs in the light field strobe across wild and captive corals which are focused and dissipated by surface water lensing. Nevertheless, such vacillations are lessened by profoundly scattered light emanating from fluorescent tubes (Chiang et al. 2008). The 230 per minute, 5 to 10 millisecond bursts, are three-fold brighter, while the troughs may be a quarter dimmer. The experimental sunlight-analogous PAR of 800 µmol m-2 s-1 was attenuated by 50 percent at 1 m (39”) while 70 percent remains in nature (Fig 13.; Stramski & Legendre 1992).
Daily Light Integral (DLI) expresses the dose of PAR received at a location in moles of photons per meter squared per day (mol m-2 d-1). It is PAR multiplied by the total seconds of illumination divided by one million. For example, 200 µmol m-2 s-1 for eight hours (8 x 60 x 60 = 28,800 seconds); 28,800 x 200 = 5,760,000 / 1,000,000 = a DLI of 5.76 mol m-2 d-1. These calculations are helpful inasmuch as previous DLIs should be reinstated after lamp and/or fixture replacement. Wild coral-beaching DLIs were 39.15 and 41.79 mol m-2 d-1 (Fig 14.; Hill et al. 2012).

Fig 13. A graph of depth versus PAR in nature. Adapted from Michael et al. 2011.

Fig 14. A graph of depth in meters versus wild minimum and maximum daily light integrals (DLIs). Adapted from Tonk et al. 2014.
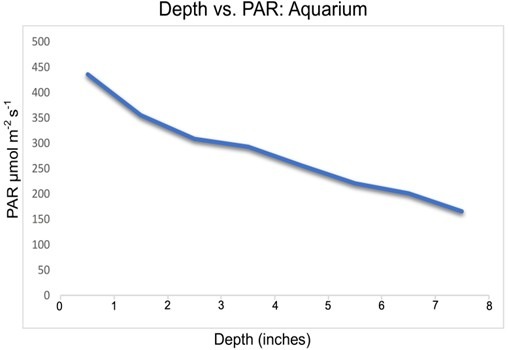
Fig 15. A graph of aquarium depth in inches versus PAR in µmol m-2 s-1 exemplifying depth and inverse square attenuation.
The cited studies suggest the most meaningful wavelengths range from 320 to 560 nm with a minor component from 635 to 680 nm in addition to nominal 700 nm red, which is beneficial for those of you with LED fixtures where the user chooses the emissions. Nevertheless, the photosynthetic microbes of hermatypic corals are much richer and diverse than previously thought because we have barely scratched the surface. For instance, species of the skeletal chlorophyte, Ostreobium exploit chlorophyll b that uses hitherto unconsidered wavelengths, while UV-protective MAAs are manufactured by non-zooxanthellar dinoflagellates of the genus Gyrodinium and the family Gymnodiniaceae (Bonacolta et al. 2023).
The inverse square law posits the intensity of artificial light is proportional to the inverse square of the distance from source:
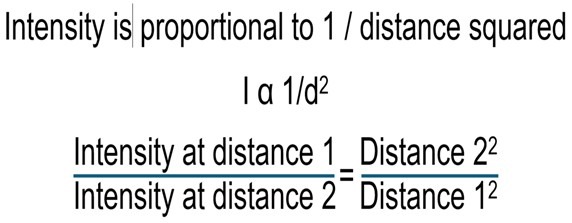
(Bates 2013)
Reflectors are a necessity for fluorescent tubes and metal halide lamps insofar as 50 percent of irradiance is otherwise excluded. Parabolic reflectors have a focal point where distal lamp emissions are focused toward the aquarium in parallel. Metal halide lamps are unidirectional so focusing their irradiance intensifies shimmer lines at the expense of backscatter, where SPS colonies require potent up- and side-welling otherwise they bleach from beneath and from the side. Metal halide lamps create intense shimmer lines and profound up- and side-welling, LEDs, however… Several reflectors are dull aluminum or have a hammered finish which favorably diffuses metal halide emissions. Correctly designed parabolic reflectors have an overhead vent or ridge that prevents photons of IR re-entering the lamp which can cause it to run hot. Lamps and fluorescent tubes must attain proper working temperatures or they can emanate abnormal spectra and their life is curtailed. Hence insulation and passive and active cooling are optimized in competently designed hybrid fixtures. T5s comfortably operate in ambients of 35oC (95oF; Lamp Tech 2011) while the arc tube of a metal halide lamp reaches 800 to 1,000oC (1,472 to 1,832oF; Davidson 2015), whereas the quantum wells of LEDs typically attain 60 to 80oC (140 to 176oF; Lighting Research Centre 2003).
Most reflectors closely follow the contours of the lamp because mirrored photons must travel twice the distance which attenuates emissions in accordance with the inverse square law (Delbeek & Sprung 2005) insofar as doubling the distance quarters the intensity. There was an initiative in the late 2000s to develop computer-designed octagonal non-parabolic reflectors for mostly single-ended (SE) 250- and 400-watt (W) metal halide lamps that were the outcome of much research. Such reflectors enhanced penetration, distribution, and focus, or attenuated irradiance with increasing depth which are evaluated in a series of articles by Professor Sanjay Joshi (Joshi et al. 2003-2005). Around that time one or two companies produced twin-arc metal halide lamps that contained 10,000K and 20,000K arc tubes that could be switched by disconnecting and reconnecting the supply. 20,000K mimicked less intense daybreak and sunset and stimulated greater fluorescence, but their PPFD was just as fierce. They required modified reflectors and pendants that ensured both arcs had their own focal point. Alas, such technology is obsolete which constrains the options for SPS devotees.
Next we conclude this journey with the practical administration of light within an aquarium.
To learn more, visit the Reef Ranch website
References
Alieva, N., Konzen, K., Field, S., Meleshkevitch, E., Hunt, M., Beltran-Ramirez, V., Miller, D., Wiedenmann, J., Salih, A. & Matz, M. (2008) Diversity and Evolution of Coral Fluorescent Proteins. PLoS ONE. 3(7), 1-12.
Ambarsari, I., Brown, B., E., Barlow, R., G., Britton, G. & Cummings, D. (1997) Fluctuations in algal chlorophyll and carotenoid pigments during solar bleaching in the coral Goniastrea aspera at Phuket, Thailand. Mar. Ecol. Prog. Ser. 159, 303-307.
Austin, R., W. & Petzold, T., J. (1986) Spectral Dependence of The Diffuse Attenuation Coefficient of Light in Ocean Waters. Optical Engineering. 25(3), 253471-253471.
Bainbridge, S., J. (2017) Temperature and light patterns at four reefs along the Great Barrier Reef during the 2015–2016 austral summer: understanding patterns of observed coral bleaching, Journal of Operational Oceanography. 10(1), 16-29.
Bates, A. (2013) The Inverse-Square Law with Data Loggers. The Physics Teacher. 51(5), 290-291.
Béraud, E., Gevaert, F., Rottier, C. & Ferrier-Pagès, C. (2013) The response of the scleractinian coral Turbinaria reniformis to thermal stress depends on the nitrogen status of the coral holobiont. The Journal of experimental biology. 216(14), 2665-2674.
Blackwell, C. (2008) Colour Vision Series 1 to 3 videos: https://youtu.be/iDsrzKDB_tA; https://youtu.be/82ItpxqPP4I; https://youtu.be/KDiTxWcD3ZE
Boilard, A., Dubé, C., E., Gruet, C., Mercière, A., Hernandez-Agreda, A. & Derome, N. (2020) Defining Coral Bleaching as a Microbial Dysbiosis within the Coral Holobiont. Microorganisms. 8, 1682.
Bollati, E., Plimmer, D., D’Angelo, C. & Wiedenmann, J. (2017) Fret-Mediated Long-Range Wavelength Transformation By photoconvertible fluorescent proteins as an efficient mechanism to generate orange-red light in symbiotic deep water corals. Int. J. Mol. Sci. 18,1174.
Bonacolta, A., M., Weiler, B., A., Porta‐Fitó, T., Sweet, M., Keeling, P. & del Campo, J. (2023) Beyond the Symbiodiniaceae: diversity and role of microeukaryotic coral symbionts. Coral Reefs. 42, 567–577. https://doi.org/10.1007/s00338-023-02352-0
Byun, D., Wang, X., Hart, D. & Zavatarelli, M. (2014) Review of PAR parameterizations in ocean ecosystem models. Estuarine Coastal and Shelf Science. 151, 318-323.
Chiang, B., I., Y., Lu, J., J. & Lee, H., S. (2008) Compact high brightness LED aquarium light apparatus, using an extended point source LED array with light emitting diodes. DiCon Fiberoptics Inc. US Patent US8568009B2.
Crisp, D. (1997) Absorption of sunlight by water vapor in cloudy conditions: A partial explanation for the cloud absorption anomaly. Geophysical Research Letters. 24(5), 571-574.
Delbeek, J., C. & Sprung, J. (2005) The Reef Aquarium: Science, Art, and Technology. Two Little Fishes Inc., d.b.a. Ricordea Publishing, 1007 Park Centre Blvd., Miami Gardens, Florida 33169, USA. p 452.
Davidson, M., W. (2015) Fundamentals of Metal Halide Arc Lamps. Education in Microscopy and Digital Imaging. Zeiss. http://zeisscampus.magnet.fsu.edu/articles/lightsources/metalhalide.html
DeMarco, P., Pokorny, J. & Smith, V., C. (1992) Full-spectrum cone sensitivity functions for X-chromosome-linked anomalous trichromats. Journal of the Optical Society of America A. 9, 1465-1476.
Depauw, F., Rogato, A., d’Alcalá, M. & Falciatore, A. (2012) Exploring the molecular basis of responses to light in marine diatoms. Journal of Experimental Botany. 63(4), 1575-1591.
Edinburgh Instruments (2019) What is the Stokes Shift? EdInst.com. https://www.edinst.com/blog/what-is-the-stokes-shift/
Ferrier‐Pagès, C., Godinot, C., D’Angelo, C., Wiedenmann, J. & Grover, R. (2016) Phosphorus metabolism of reef organisms with algal symbionts. Ecological Monographs. 86(3), 262-277.
Gittins, J., R., D’Angelo, C., Oswald, F., Edwards, R., J. & Wiedenmann, J. (2015) Fluorescent protein-mediated colour polymorphism in reef corals: multicopy genes extend the adaptation/acclimatization potential to variable light environments. Mol. Ecol. 24, 453-465.
Hill, R., Larkum, A., Prášil, O., Kramer, D., Szabó, M., Kumar, V. & Ralph, P. (2012) Light-induced dissociation of antenna complexes in the symbionts of scleractinian corals correlates with sensitivity to coral bleaching. Coral Reefs. 31(4), 963-975.
Joshi et al. (2003 to 2005) Analysing Reflectors parts I to IV. AdvancedAquarist.com. https://www.advancedaquarist.com/2004/3/aafeature
Joshi, S. (2004) Product Review: Spectral Analysis of 400W Double Ended Lamps. AdvancedAquarist.com. https://www.advancedaquarist.com/2004/10/review1
Joshi, S. (2005) Feature Article: Underwater Light Field and its Comparison to Metal Halide Lighting. AdvancedAquarist.com. https://www.advancedaquarist.com/2005/8/aafeature/view?searchterm=mh%20bulbs
Kuhl, M., Cohen, Y., Dalsgaard, T., Jergensen, B., B. & Revsbech, N., P. (1995) Microenvironment and photosynthesis of zooxanthellae in scleractinian corals studied with microsensors for 02, pH and light. Mar. Ecol. Prog. Ser. 117, 159-172.
Lamp Tech (2011) http://www.lamptech.co.uk/Documents/FL%20Temperature.htm
Levy, O., Dubinsky, Z. & Achituv, Y. (2003) Photobehavior of stony corals: responses to light spectra and intensity. Journal of Experimental Biology. 206, 4041-4049.
Lighting Research Centre (2003) LED lighting Systems. National Lighting Product Information Program. 7(3),. https://www.lrc.rpi.edu/programs/nlpip/lightinganswers/led/heat.asp
Lynch, J., C. & Corbett, J., J. (2015) Chapter 20, The Visual System. https://clinicalgate.com/the-visual-system-2/
Lyndby, N., H., Kühl, M. & Wangpraseurt, D. (2016) Heat generation and light scattering of green fluorescent protein-like pigments in coral tissue. Sci. Rep. 6, 26599.
MacKellar, M., McGowan, H. & Phinn, S. (2011). Spatial Heterogeneity of Air–Sea Energy Fluxes over a Coral Reef—Heron Reef, Australia. Journal of Applied Meteorology and Climatology. 51(7), 1353-1370.
McCauley, M., Goulet, T., L., Jackson, C., R. & Loesgen, S. (2022) Systematic review of cnidarian microbiomes reveals insights into the structure, specificity, and fidelity of marine associations. Nature Communications. 14, 4899.
Michael, J., K., Cameron V., J. & Manuel, N. (2011) Attenuation coefficients of ultraviolet and photosynthetically active wavelengths in the waters of Heron Reef, Great Barrier Reef, Australia. Marine & Freshwater Research. 63(2), 142-149.
Neptune Systems (2019) #LetsTalkReef – Today its all about measuring light – with Guest Dana Riddle. https://www.youtube.com/watch?v=LKlFA59-Acc
Nguyen, D., V. (2013) Vegetation Detection and Terrain Classification for Autonomous Navigation. Dissertation: zur Erlangung des Grades eines Doktors der Ingenieurwissenschaften. https://www.nguyen.pdf
Nielsen, D., A., Petrou, K. & Gates, R., D. (2018) Coral bleaching from a single cell perspective The ISME Journal. 12, 1558-1567.
Oswald, F., Schmitt, F., Leutenegger, A., Ivanchenko, S., D’Angelo, C., Salih, A., Maslakova, S., Bulina, M., Schirmbeck, R., Nienhaus, G., U., Matz, M., V. & Wiedenmann, J. (2007) Contributions of host and symbiont pigments to the coloration of reef corals. The FEBS Journal. 274, 1102-1122.
Riddle, D. (2004) Feature Article: Playing With Poison – Ultraviolet Radiation. https://www.advancedaquarist.com/2004/8/aafeature
Riddle, D. (2014) Photosynthetic Efficiencies of LEDs: Results of Short Term Exposure to LED Lights. https://www.advancedaquarist.com/2014/5/aafeature
Riddle, D. (2014a) Effects of Yellow Water on Light Transmission in an Aquarium – Why Should You Care. AdvancedAquarist.com. https://www.advancedaquarist.com/2014/1/aafeature
Riddle, D. (2016) Feature Article: Montipora digitata: A Stony Coral for All Hobbyists. The Marine Aquarium Council of North America. BulkReefSupply.com. https://youtu.be/fBktpJ3umAs
Roth, M. (2014) The engine of the reef: photobiology of the coral–algal symbiosis. Frontiers in Microbiology. 5, 1-22.
Sager, J., C. & Mc Farlane, J., C. (1997) The Plant Growth Chamber Handbook. Chapter 1, Radiation. https://www.controlledenvironments.org/wp-content/uploads/sites/6/2017/06/Ch01.pdf#
Smith, E., G., D’Angelo, C., Sharon, Y., Tchernov, D. & Wiedenmann, J. (2017) Acclimatization of symbiotic corals to mesophotic light environments through wavelength transformation by fluorescent protein pigments. Proc. Biol. Sci. 284, 20170320.
Starcevic, A., Dunlap, W., C., Cullum, J., Shick, J., M., Hranueli, D. & Long, P., F. (2010) Gene expression in the scleractinian acropora microphthalma exposed to high solar irradiance reveals elements of photoprotection and coral bleaching. PLoS ONE. 12. 5(11), 13975.
Stramski, D. & Legendre, L. (1992). Laboratory simulation of light-focusing by water-surface waves. Marine Biology. 114(2), 341-348.
Tonk, L., Sampayo, E., LaJeunesse, T., Schrameyer, V., Hoegh‐Guldberg, O. & Mock, T. (2014) Symbiodinium (Dinophyceae) diversity in reef‐invertebrates along an offshore to inshore reef gradient near Lizard Island, Great Barrier Reef. Journal of Phycology. 50(3), 552-563.
Tyree, S. (2000) Stony Coral Pigments, Algae Pigments and Captive Light. http://www.reefs.org/library/talklog/s_tyree_060202.html
Venn, A., A., Wilson, M., A., Trapido‐Rosenthal, H., G., Keely, B., J. & Douglas, A., E. (2006) The impact of coral bleaching on the pigment profile of the symbiotic alga, Symbiodinium. Plant Cell & Environment. 29(12),.
![]()
0コメント