Newcomers to the reefkeeping hobby may not be familiar with the many questions surrounding the issue of lighting in the early days of the hobby. Then, we assumed nature to be the ideal model for lighting – light intensity mimicking sunlight had to be better, blue light seemed to promote coloration, and so on. Today we understand that light that is too intense can be detrimental to zooxanthellae and the host coral. Simple experiments using PAM fluorometry can quickly and easily confirm that zooxanthellae do not have unlimited adaptive responses to high amounts of light.
Experiments examining the effects of spectral qualities on coral growth are not as easily done. Spectral quality for each lamp must be analyzed, of course, in order to understand its effects. Ideally, the experiment utilizes an aquarium that houses all target corals at the same time in order to ensure water quality parameters are standardized (which is virtually impossible when experiments are conducted during separate time frames.) Light intensity must be standardized (an expensive PAR meter is required since this is not easily done when using a ‘hobby grade’ PAR meter.) And these experiments are time-consuming. With that said, I’ll detail the procedure next. If you’re not particularly interested in these minutiae, skip to the Results and Discussion section below.
Experiment’s Protocol
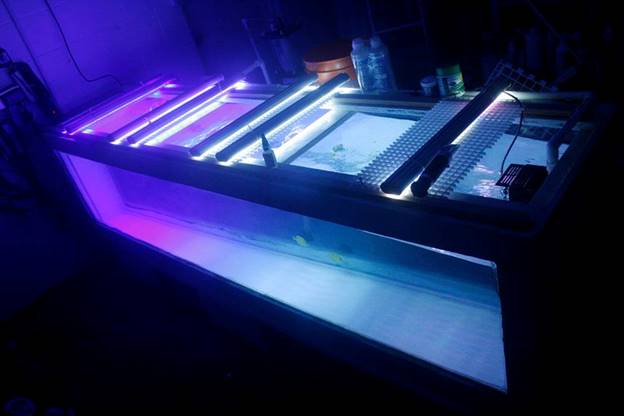
Figure 2. Build My LED strip lamps were mounted to egg crate material, which in turn were held in place by guides. This allowed quick disassembly and reassembly while maintaining the lamps in precise positions.
Corals tentatively identified as Porites lobata were maintained in a 240-gallon aquarium (8′ x 2′ x 2′) See Figure 2. A 100-gallon Rubber Maid sump housed a protein skimmer (ETS model 800, driven by a Danner Mag 9.5 centrifugal pump), a reactor containing granular ferrous oxide for phosphorus removal (Two Little Fishies), and a return pump (Danner Mag 7.5.) The protein skimmer’s effluent traveled through a small plastic basket filled with the macroalga Chaetomorpha and illuminated by a LED strip light (Build My LED). Together, this equipment maintained reactive phosphorus and inorganic & organic nitrogen species to extremely low levels. Three fishes (two Yellow Tangs and a Chevron tang) were housed in the aquarium.
The 240-gallon aquarium was illuminated by 7 LED strip lights (identified as Solar- Max, 2-6500K, 2-20,000K, and 2-Custom strips; all from Build My LED) placed approximately 20 inches apart. Light intensity was adjusted through use of dimmers (Build My LED) and maintained at an intensity of 128 µmolm²sec through the duration of the procedure. This light intensity is sub-saturating and was originally measured with a Li-Cor LI-1400 data logger and submersible quantum sensor. These measurements were compared to those obtained by an Apogee PAR meter and correction factors were determined. Since this experiment involved light measurements in tight quarters, the small size of the Apogee sensor was a plus; hence it was used periodically to ensure ‘proper’ light intensity was maintained. Photoperiod was 12 hours on/ 12 hours off.
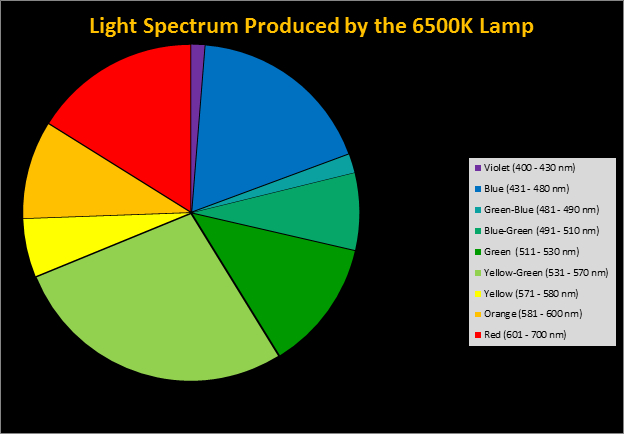
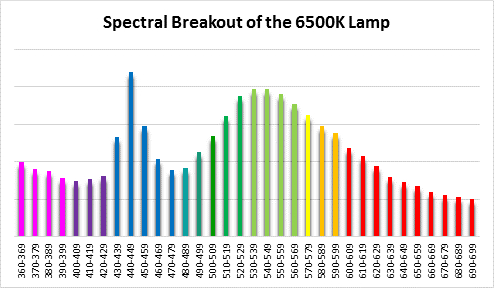
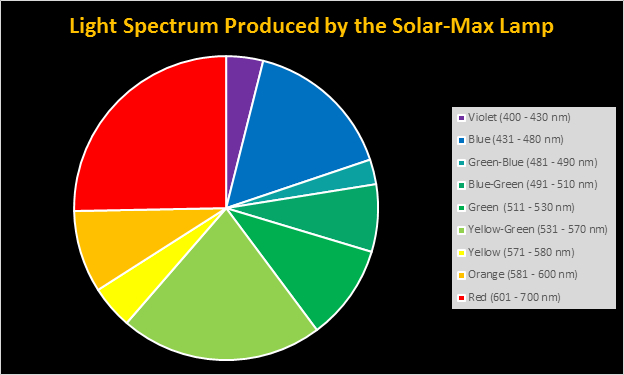
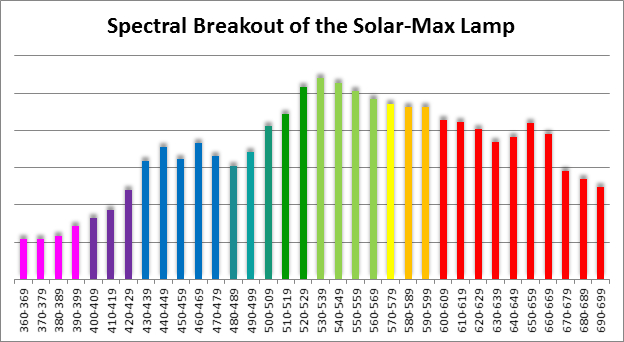
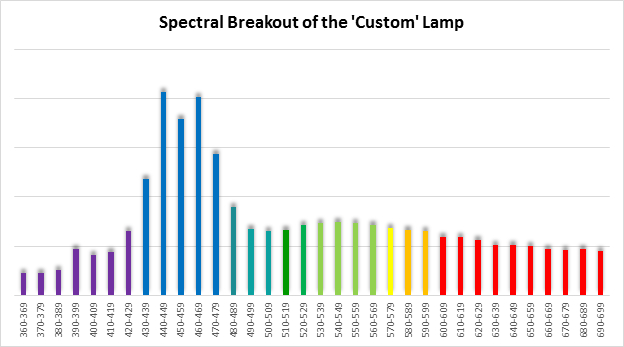
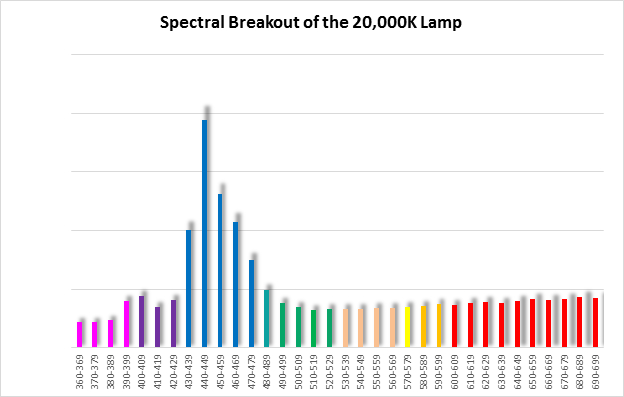
Spectral qualities were determined with a fiber optic spectrometer (USB2000, Ocean Optics) and their software (OceanView™.) The spectrometer’s patch cord gathered light reflected from a diffuse reflectance standard (99%, Spectralon.) Results were exported to a proprietary Microsoft Excel program for further analyses. Note: The charts showing spectral data in 10nm increments were not corrected for the instrument’s dark signal.
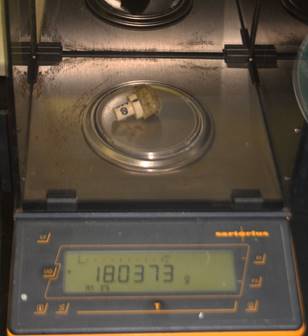
Figure 3. This coral (mounted on a ceramic plug) is weighed on an analytical balance to 1/10th of a milligram.
Water motion, an important parameter since it can affect coral respiration, was homogenous throughout the tank through use of a ‘Wave Generator’ (tunze Wave Box™.) Although a digital water meter (FloMate 2000, Marsh-McBirney) was available, it was unable to accurately measure pulses generated by the tunze device. Hence, water motion (~3″/sec; oscillating) was determined visually by measuring movement of floating pelletized fish food.
One coral specimen was divided in equally sized fragments by cutting 1″ diameter nubbins from the colony with a 1″ diamond hole saw. These were allowed to heal for several days, and then glued to fired ceramic plugs (Boston Aqua Farms) with SuperGlue. A Sharpie™ permanent marker had been used previously to make identification markings on each ceramic plug. These plugs/corals fit neatly into egg crate jigs built to maintain positions under the LED strip lights. Ten corals each were maintained under each spectrum for a period of 75 days. Corals/plugs (plugs gently brushed to clear any fouling growths and entire surfaces blotted dry) were weighed every two weeks or so through use of an analytical balance (Sartorius, resolution of 0.0001 gram – see Figure 3.) Corals were rotated under their respective lights after each weighing in order to minimize any minor differences in spectral quality.
Chlorophyll content was also determined in milligrams/square meter by a fiber optic chlorophyll meter (CCM-200, OptiScience), and this will be discussed in a future article.
LED Lights
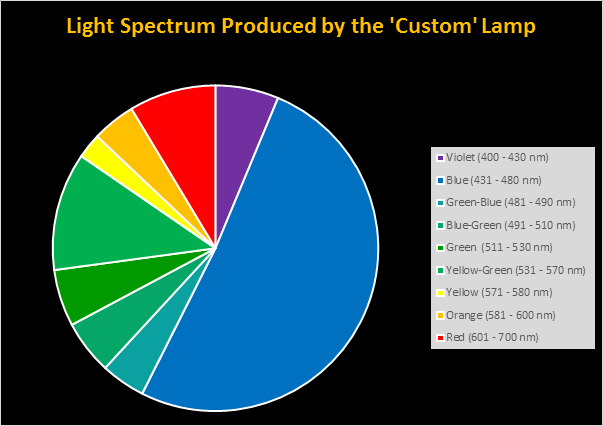
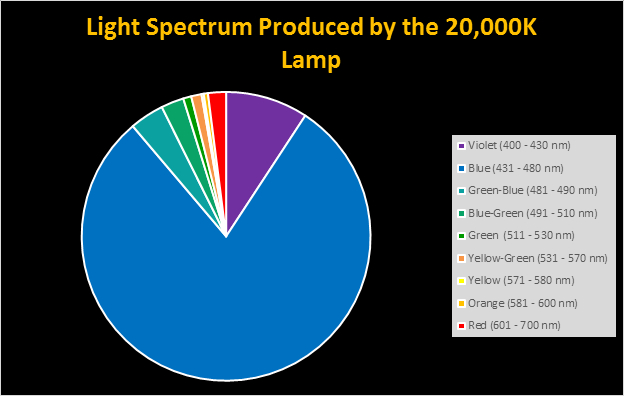
Four distinctly different spectral signatures were generated by LED strip lights. These were identified as Solar Max (warm sunlight), 6,500K (cool sunlight), Custom (visually similar to the spectrum of metal halide lamps marketed as ~14,000K), and 20,000K (very blue.) See Figures 4 through 11.
Daily Light Integral
The Daily Light Integral (DLI) is the sum of the number of photons falling upon a given surface area during the entire photoperiod. PAR meters report the number of photons falling on a given surface area in one second. This is similar to counting the number of raindrops falling in one second, when we’re really interested in the total amount of rainfall. This is what DLI reports, and it is reported as molphotonsm²photoperiod. DLI is easily calculated:
DLI = 128 µmolmsec * 60 seconds/minute * 60 minutes/hour * 12 hours/photoperiod ÷ 1,000,000 = 5.53 molphotons
To put this in perspective, corals in a shallow Hawaiian tide pool receive a DLI of about 22 molphotons during a February photoperiod of 11.5 hours, and about twice that during a cloudless summer day.
Coral Growth
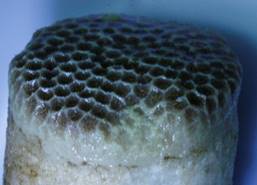
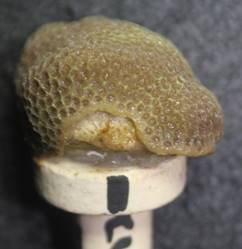
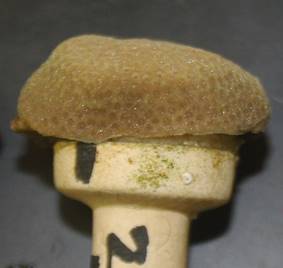
Survival rates were 100% for all corals, and all exhibited growth. See Figures 12 – 15.
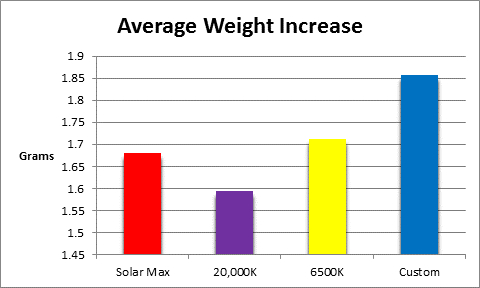
Figure 15 shows the average weight gain of the 4 groups (n = 10 each.)
Conclusion and Discussion
All LED luminaires promoted coral growth over the course of the 75 day procedure and although there were differences, they were not statistically significant.
The results ask more questions than the procedure answered. Since others have demonstrated statistically significant growth rates under differing light regimens at similar light intensities (Wijgerde and Laterveer, 2013), and effects of spectral quality on photophysiology (Wijgerde et al., 2014), why did these corals not exhibit significant differences? There are many possibilities. Perhaps the light intensity chosen (128 µmolm²sec) was simply too low and barely exceeded this zooxanthella clade’s compensation point (the Clade is assumed to be C15, found almost exclusively in Pacific Porites. However, Wagner et al. (2010) found Hawaiian black corals from depths up to 396m (~1,300 feet) where light levels were too low to support photosynthesis, raising the possibility that the association between the host and endosymbiont might not be mutualistic.) Another possibility is flow-related. It is possible the rate of flow (estimated to be ~3″/second) was not sufficient to minimize the momentum boundary layer and thus created a nutrient gradient where a starvation situation of sorts existed.
The take home message suggests that low light intensity does not significantly affect growth rates of this shallow-water Porites under the conditions of this experiment.
Experiments designed to answer questions raised by this procedure are now underway.
Acknowledgements
I wish to thank Build My LED (www.buildmyled.com) for supplying the LED strip lights used in this experiment.
References
- Wagner, D., X. Pochon, L. Irwin, R. Toonen, and R. Gates, 2010. Azooxanthellate? Most Hawaiian black corals contain Symbiodinium. http://rspb.royalsocietypublishing.org/content/early/2010/10/19/rspb.2010.1681
- Wijgerde, T. and M. Laterveer, 2013. Coral growth under Light Emitting Diode and Light Emitting Plasma: a cross-family comparison. http://www.advancedaquarist.com/2013/2/aafeature
- Wijgerde, T., A. van Melis, C. Silva, M. Leal, L. Vogels, C. Mutter, and R. Osinga, 2014. Red light represses the photophysiology of the scleractinian coral Stylophora pistillata. Plos One, http://journals.plos.org/plosone/article?id=10.1371/journal.pone.0092781



There was a following experience?