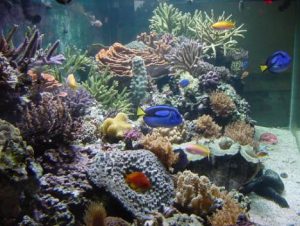
One of the most beautiful, yet often overlooked, aspects of the coral anatomy is the skeleton. With most coral species, the “living material” usually covers up the fine details of this aragonite (CaCO3) based skeleton built by the individual polyps. The coral polyp is truly nature’s architect and engineer. It is in the coral skeleton where nature is transformed into art. In this article, we present several examples of imaging experiments to explore the inner beauty of the corals, conducted on corals grown in captivity at the Penn State HUB-Robeson Aquarium’s Indo-Pacific Reef Tank seen in Figure 1 (www.aquarium.psu.edu). This aquarium is part of a public display of environmental ecosystems established on the University Park campus through a gift from the graduating class of 1999.
Two different imaging techniques were used:
- Scanning Electron Microscopy
- X-Ray Tomography
The first imaging technique, scanning electron microscopy, uses beams of electrons instead of light to take scanned pictures. Traditional visible light microscopes are incapable of clearly imaging very small objects and have a resolution limited to around 0.2 μm (1 μm = 1 millionth of a meter). Generally speaking, the resolution of an imaging technique is limited by the wavelength of the radiation being used. Visible light corresponds to wavelengths of around 400 to 750 nm (1 nm = 1 billionth of a meter). In order to take sharp images of small, detailed objects, radiation with a smaller wavelength must be used. The answer comes in the form of a streaming beam of electrons. Visible light is a form of electromagnetic radiation which consists of an oscillating electric and magnetic field. An electron beam is a ‘matter wave.’ According to the laws of quantum mechanics, all moving objects will be associated with a particular wavelength. The wavelength of macroscale objects, such as a baseball, is extremely small, less than the size of atoms, and thus not seen. However, the wavelength of electrons, which have been accelerated to a high energy, is in a perfect range for use in imaging experiments; that is, smaller than visible light but larger than macroscale objects.
The scanning electron microscope (SEM) has many similarities to a visible light microscope. Both types use a series of lenses to focus the radiation, although in an SEM the lenses are made of electromagnets instead of glass or plastic. In a visible light microscope the images are formed by collecting either the light reflected from or transmitted through the object. In an SEM the beam of electrons striking the sample induces the emission of ‘secondary electrons’ from the sample surface which can be detected by the instrument. Within the SEM, a beam of electrons is accelerated to very high energies using an electric filed, focused on the point being analyzed with electromagnetic lenses, and the electrons ejected from the sample at this point detected. The instrument is called ‘scanning’ since the tiny point of focused electrons is rapidly scanned across the entire region being imaged, much like the electron gun in a television. The information collected from the scanning beam can be sent to a computer and compiled into an image.
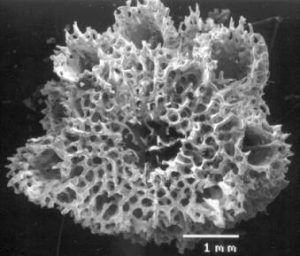
The following set of images is a representative sample of coral SEM analysis at a variety of magnifications (The actual magnification of each image depends on the dimensions of the image being viewed, thus specific magnification factors are not listed for each image. The scale bar used in figure does give an accurate representation of the size of the sample shown in each image as the size of this bar will scale directly with the image). For most of the SEM images the organic material, including the polyps and protective ‘slime’ coating, have been chemically removed to expose the bare skeleton. Figure 2 shows an entire cross section of an arm of Acropora. In this image the central axial polyp shaft is clearly visible along with the shafts from several radial polyps. In terms of typical uses for the SEM, this image is actually quite ‘zoomed out’ and required several adjustments to the instrument in order to take such a wide angle shot.
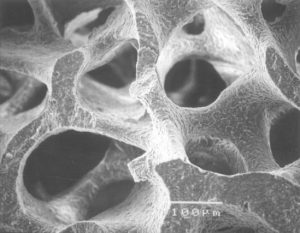
The next set of images begins to zoom in on a particular region of the coral skeleton in order to show some of the finer structural details. Figure 3 represents an image that is approximately ten times the magnification of the image in Figure 2. As we zoom in, rough size measurements of particular sections of the skeleton can be made. For example, by using the scale bar in Figure 3 we can estimate the thickness of each section of the complex skeletal structure to be about 50 μm across.
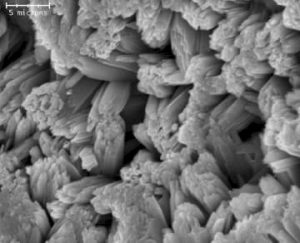
Once the sample has been loaded into the SEM instrument, it can be easily rotated and moved to just about any position desirable. This flexibility allows for almost every crack and crevice on the outer surface of the coral to be explored. In some circumstances, the individual aragonite crystals on the skeletal be seen. Figure 4 shows a fascinating close-up view of the skeletal surface.
The scale bar in the upper left corner of Figure 4 represents a distance of 5 μm. At this magnification, the skeletal surface appears as a series of aragonite crystal columns approximately 3-4 μm in diameter. These images may initially look more like an alien landscape than what most people think of when picturing corals; however, remember that everything seen in the previous set of images was created by the living polyp microorganisms.
The SEM images allow us to take very detailed images of coral skeleton, although this technique does have some drawbacks. First, the sample preparation is quite labor intensive and depending on the protocol can take up to several days. In addition, since the SEM uses beams of electrons (essentially electricity) in place of light, the samples must also be conductive. To accomplish this, each sample is plated with an extremely thin coating of a gold ‘ palladium alloy prior to any imaging experiments. Also, in most instances in order to obtain quality images of the inorganic skeleton all the organic material must be first removed from the surface.
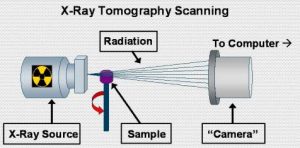
Another imaging technique which we have employed to study corals is x-ray tomography. This technique is very similar to medical CAT scans. Essentially, a consecutive series of x-ray images is taken from 0 ‘ 360’ around the sample. Powerful computers can then compile these images into cross sectional ‘slice’ of the sample being analyzed. Figure 5 shows a rough schematic of the major components in the x-ray tomography imager that we used.
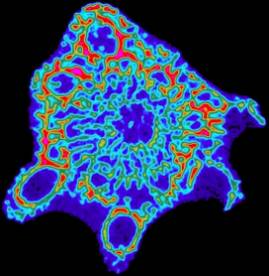
One of the major advantages to using this technique is that the images can be analyzed immediately upon removal from the tank, or even in a container of water, since there is essentially no sample prep required. Once the sample is in place, it only takes about two minutes to obtain a cross sectional image. In this particular imaging technique the resulting data is false colored during the computational analysis. The colors are assigned based on density since more x-rays are absorbed in regions of higher density. Figure 6 displays a color bar key for the density assignments in the x-ray images. Figure 7 below shows a typical computer generated tomography of the same species of Acropora used in the previous SEM experiments.
Since the images are colored by density, empirical observations concerning the role of aragonite density within the skeletal structure can be easily made. In almost all cases, we observe that the exterior sections of the coral skeleton are denser than the interior sections. This is clearly visible in the image shown in Figure 7 where the exterior shows up as oranges and reds while the interior appears as greens and blues. The dark blue background visible throughout the entire sample results form water and ‘slime’ which still cover the freshly harvested coral tip. Depending on how the sample is placed within the instrument, it is also possible to obtain longitudinal scans across a particular section. Figure 8 shows the same sample, but imaged from a right angle to the plane shown in Figure 7.
The most striking feature seen in this type of scan is the long shaft which extends through the center of the arm down its entire length as a result of the axial polyp. In the bottom left, part of a radial polyp shaft can be seen protruding from the main arm. It is interesting to note that, at least in this particular species, the radial polyp shafts do not extend all the way into the axial polyp shafts, suggesting that axial polyp builds a ‘wall’ closing off any direct hole between the axial and radial polyp shafts.
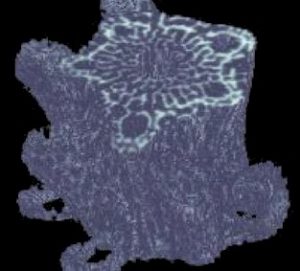
Just like SEM, the x-ray tomography technique has its disadvantages. First, the resolution of the x-ray images is not nearly as high as the SEM images. Second, the cross sectional scans do not have the same ‘3-D’ look as the SEM scans. This latter problem can at least be partially solved through the use of some additional computer software. If a series of consecutive cross- sectional scans is collected, the resulting ‘stack’ of data can be compiled into a 3-D model. This model can then be rotated to any angle in order to produce a constructed 3-D image from the collected 2-D data. An example of such an image is shown in Figure 9.
The overall features of the compiled image shown in Figure 9 can be compared with the SEM scan shown in Figure 2. It is interesting to note how despite drastic differences in data collection, the final result appears quite similar. Each image has its advantages and disadvantages. The complied x-ray data can be rotated in any direction and can even be ‘cut open’ to expose the interior regions; however, this image is at fairly low resolution. Alternatively, the SEM image is at very high resolution, but can not be rotated without actually rotating the sample within the instrument and taking another image.
One striking feature of the x-ray scans is that even though the samples were imaged ‘live’ the polyps can not be seen. An explanation for this phenomenon lies within the elemental composition of the polyps and skeleton. The skeleton is composed primarily of aragonite which is a form of calcium carbonate (CaCO3). The polyps, living microorganisms, are composed primarily of carbon based molecules with other elements such as nitrogen, oxygen, and hydrogen also quite abundant. The success of the x-ray technique relies on the ability of a sample to absorb x-ray radiation. Generally speaking, atoms with a large nucleus absorb more x-rays than those with smaller nuclei. The size of the nucleus is roughly proportional to the atomic mass of the atom in question. Table 1 shows the atomic mass (in atomic mass units) for the elements mentioned previously.
| Element | Atomic Mass (amu) |
|---|---|
| Hydrogen | 1.01 |
| Carbon | 12.01 |
| Nitrogen | 14.01 |
| Oxygen | 16.00 |
| Calcium | 40.08 |
While the specific meaning of the atomic mass units is not relative to this discussion, the main thing to notice is the relative mass ratio between calcium and the other elements commonly found in corals. From the data in Table 1 it is obvious that the nucleus in calcium atoms is much bigger than any of the other elements listed. This accounts for the strong absorbance of x-rays relative to the softer tissues in the coral. This same phenomena is observed in standard medical x-ray images where bones show up very clearly, while soft tissues can not usually be distinguished. One way to get around this obstacle is through the use of selectively binding dyes which strongly absorb x-rays. This technique is widely found in the medical field, such the ingestion of a barium slurry for x-ray imaging of the GI track. In the same fashion, we have been able to use selective dyes to highlight the location of the polyps within the skeleton (data not shown).
Modern instrumental techniques provide us with unique views of seemingly benign coral skeleton. Upon closer investigation, this often overlooked feature presents us with fascinating displays of Mother Nature’s construction team at its best. While these are pretty to look at, they also serve a major role in scientific research into the effects of pollution and other stresses on natural coral reef ecosystems. Through the use of the presented imaging techniques, detailed observations of skeletal variations in ‘damaged’ coral skeletons can be taken and compared to their ‘healthy’ counterparts. Through this, and other forms of research we can strive to understand the molecular reasons behind such empirical observations as coral bleaching and stress induced structural damage.





0 Comments