
 We had the opportunity to test the new ATI Straton thanks to Jonathan, who just bought three of them for his tank. We analyzed the PAR and created the distribution curves. Let’s see how it went.
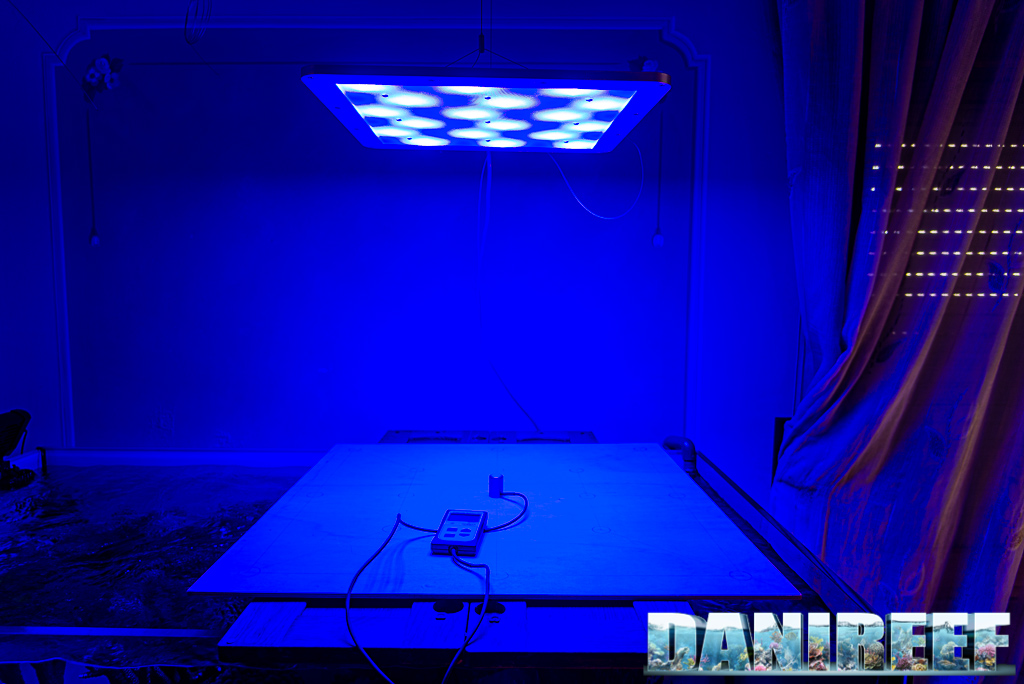
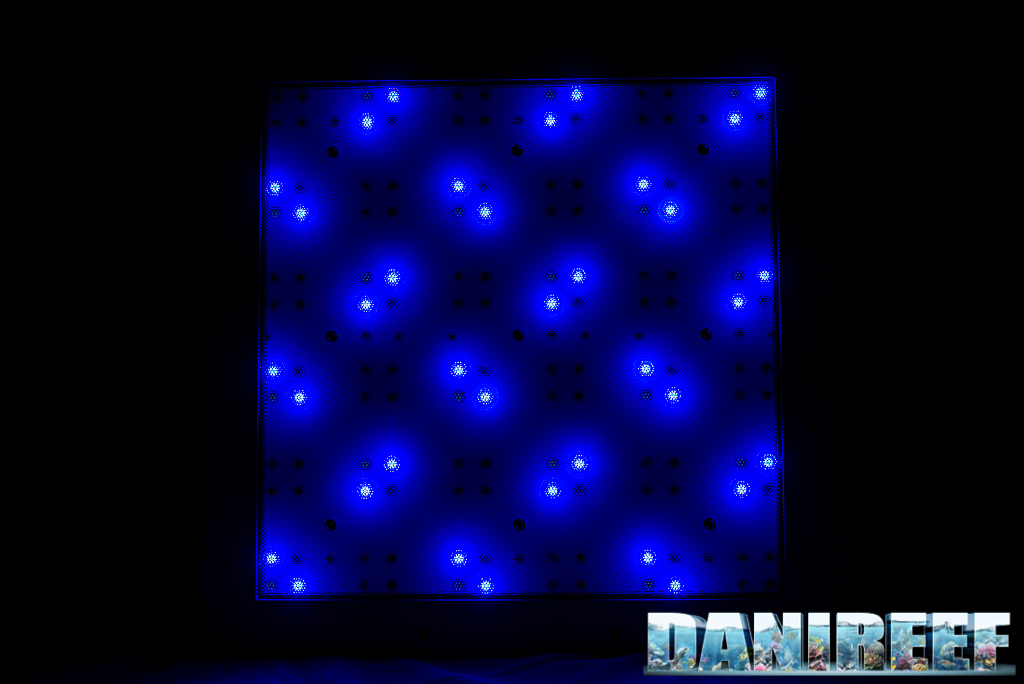
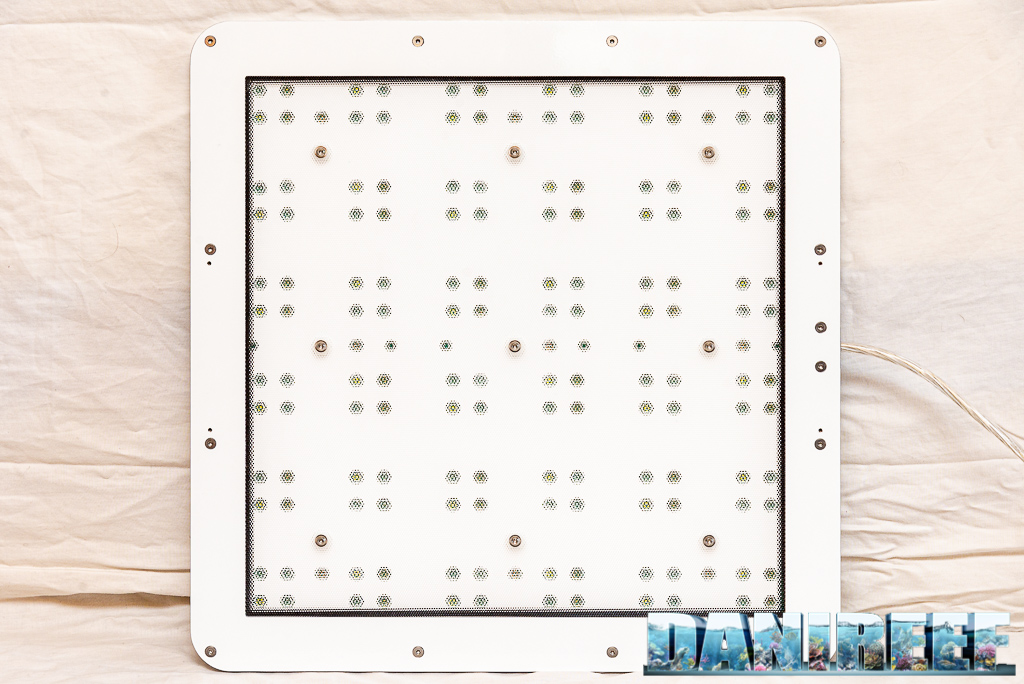
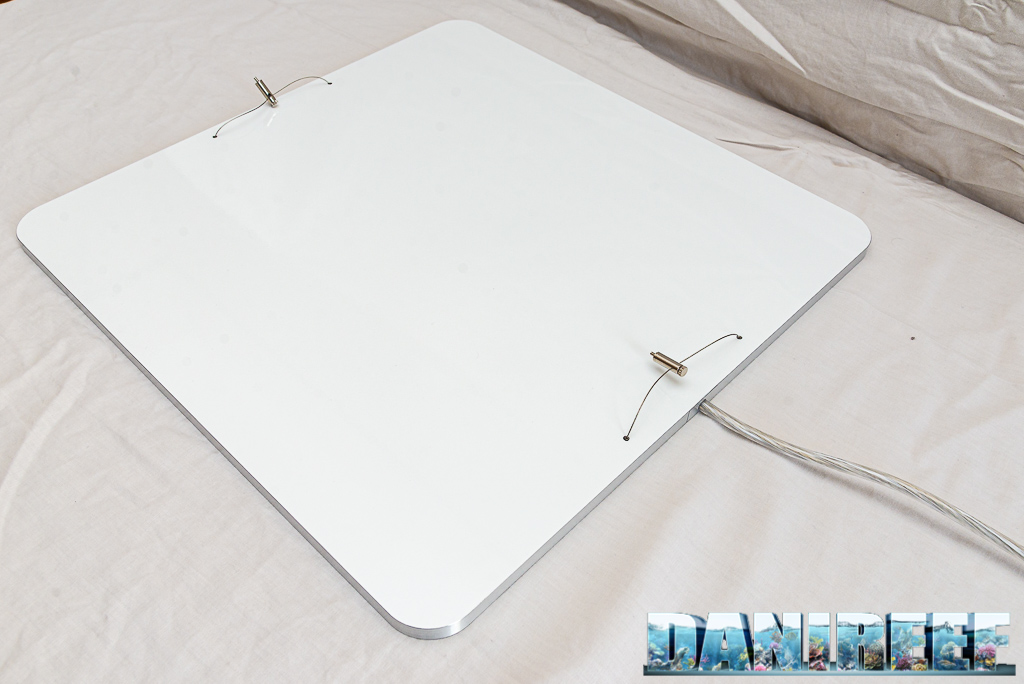
The ATI Straton is a LED ceiling light that has been on the market since last year, then due to the Coronavirus and the well-known slowness of ATI, has been distributed at a snail’s pace. Despite this, we really like this ceiling light, both because of the distribution of the LED and for other things we’ll reveal in this interview. The ceiling light is very thin and uses a passive cooldown, which is a critical point that always comes out about this ceiling light.
Technical characteristics of the ATI Straton
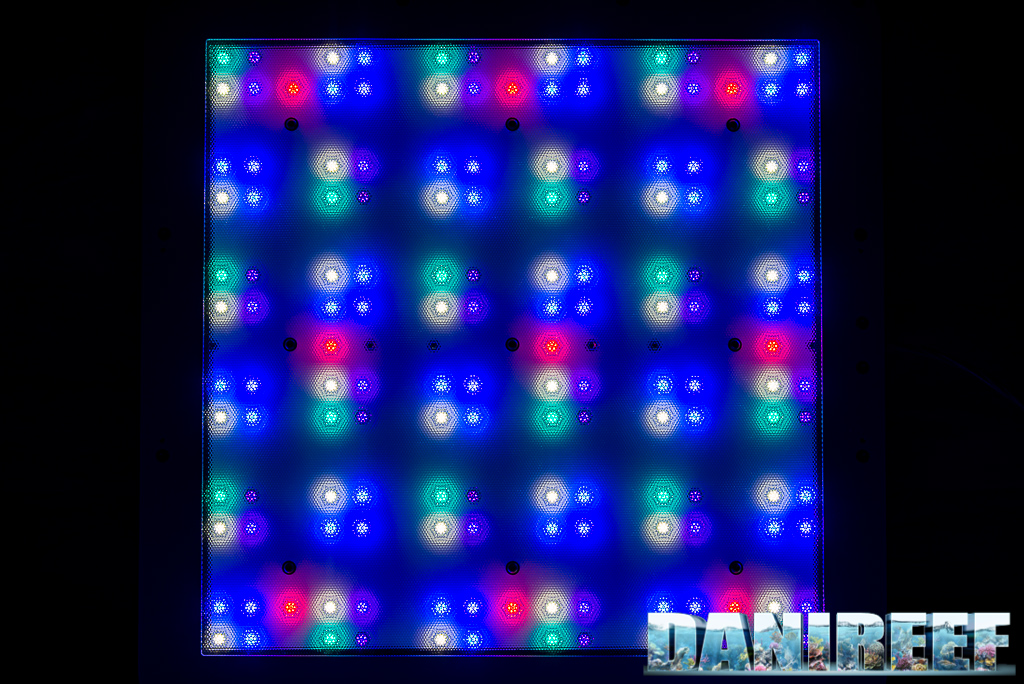
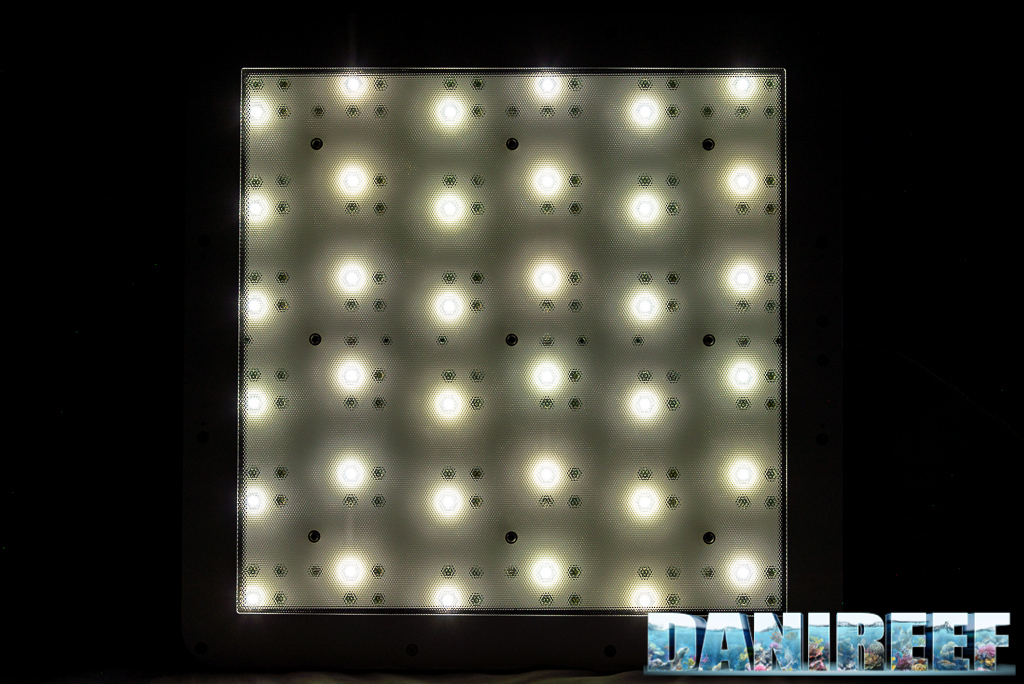
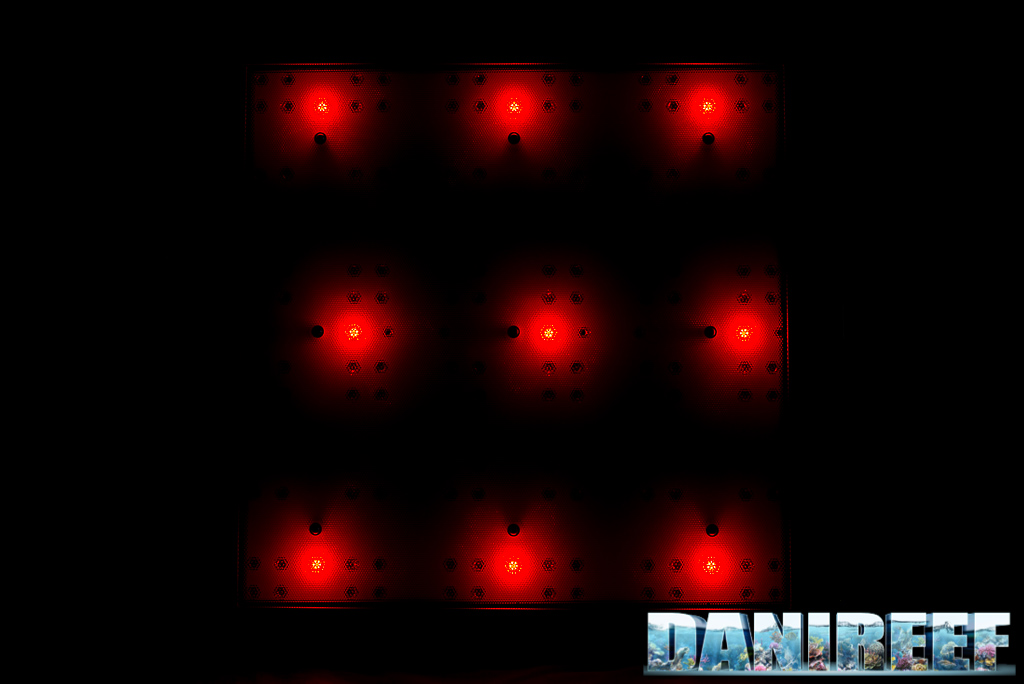
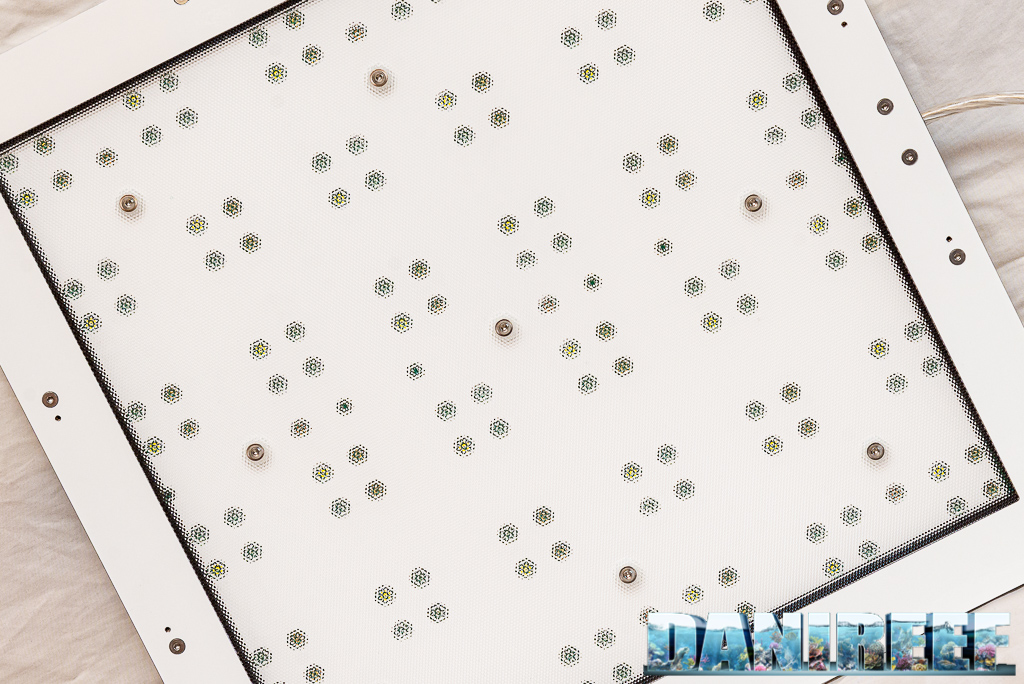
The ceiling light is square, and only 14 millimeters high, with 7 LEDs of different colorations divided into 7 channels, so each channel has only one LED. There aren’t any LEDs for moonlight, which are present in other ceiling lights. The LED aren’t distributed but grouped in sets of 4. Moreover, Straton has logically divided the LEDs into three parallel bands that can be managed individually, creating different switching, but also dimming the bands in case the temperature goes over 55 degrees C (131 F) , without switching them off.
| Characteristics | |
| Dimensions | 470x470x14 mm |
| White LED | 36 |
| Royal Blue LED 450 nm | 18 |
| Blue LED 470 nm | 36 |
| Red LED | 9 |
| UV LED 405 nm | 18 |
| Purple LED 420 nm | 18 |
| Cyan LED 500 nm | 18 |
| Total number of LED | 153 |
| Maximum total consumption | 230 watt |
| Price | 890 euro |
Construction
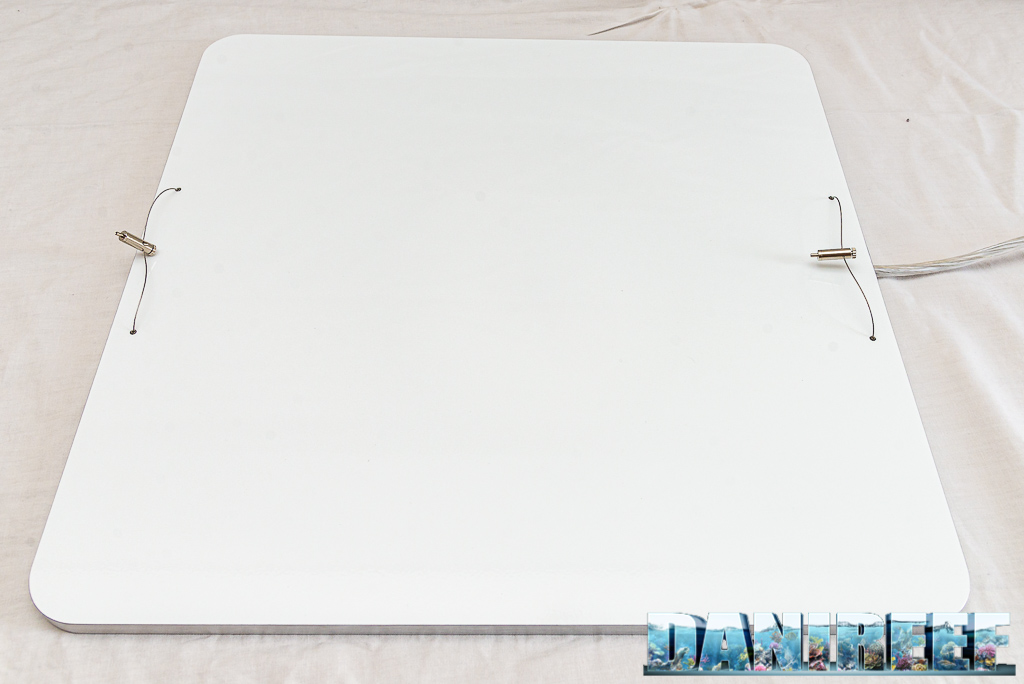
The construction of the ceiling light is flawless. There aren’t any creaks and the structure is just so solid. We know that the inside of the aluminum works as heatsink, but we don’t know precisely how it’s made because we didn’t disassembled it, even though we were extremely curious. There aren’t any buttons. The ceiling light turns on when it connects to the power then is set through WiFi. I would have preferred Bluetooth, but we’ll see this detail later.
The programming
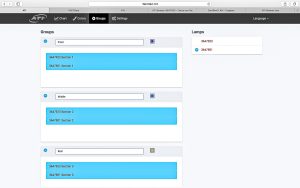
The ceiling light has to be set through a web app. This means that there isn’t a specific app, but a website for our browser. This solution is more powerful because allows any device with a web interface to interact with the ceiling lights, but not all the devices can visualize the page well, and the access configuration is not that intuitive. The web app is available only in English and Dutch. We used the English version.
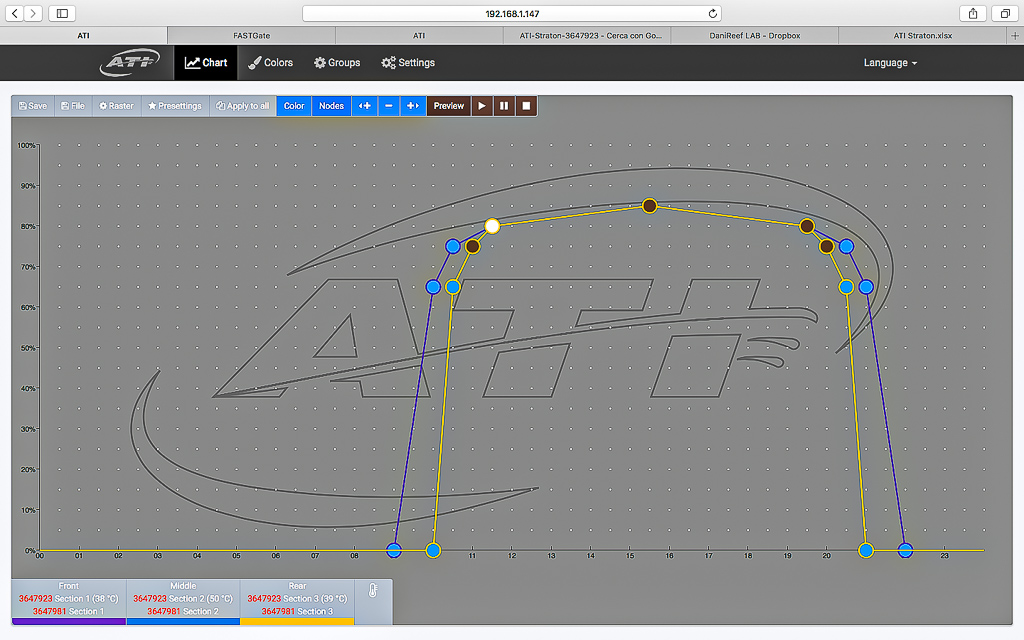
Pictured above is the chart where we set the curve. In order to make it simpler we made a video in which we connect and set the ceiling light, so we won’t have to spend too much time on this topic. Above there’s the basic set that switches on the bands of the ceiling light.
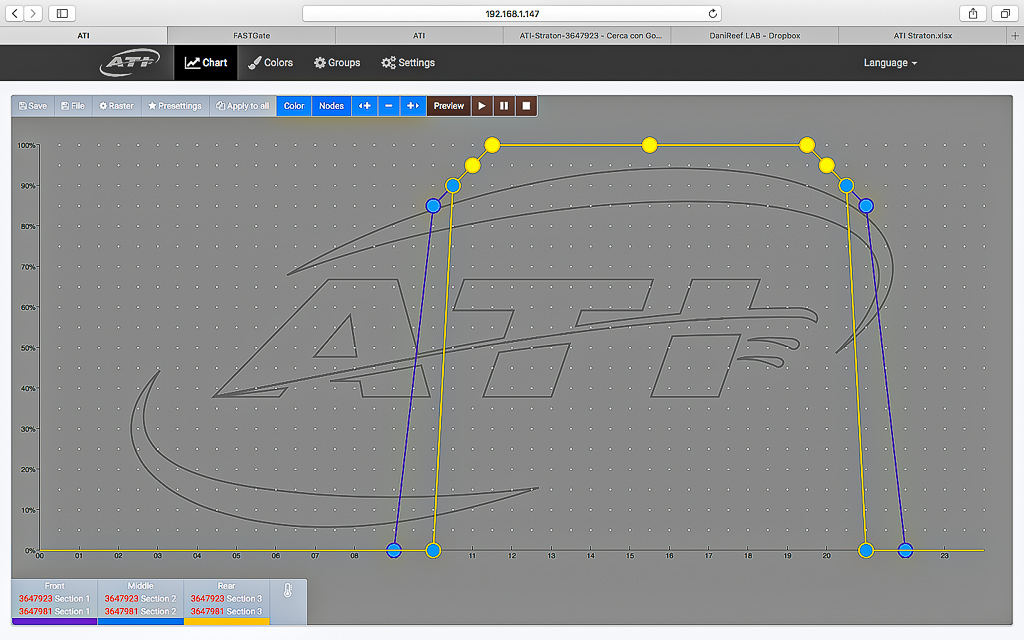
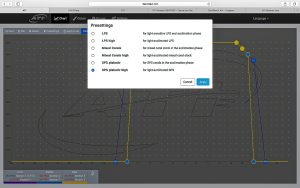
You can create or modify the curves, or even choose one from the available preset. We always recommend this choice, unless you know exactly what you’re doing. In fact, with a ceiling light that allows you to change all the channels, it’s extremely easy to create problems for the corals by lowering certain channels too much or forcing others too much. On the lower left, you can see the temperatures in real time.
One last note about the curves: you first have to set some channels per color, then bring them to the curve. It’s not very intuitive, but once you understand the process, it’s not that difficult, even if requires more time than usual.
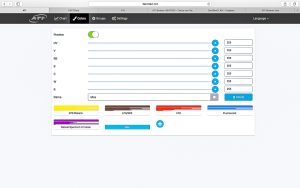
Channel 1: UV
Channel 2: Purple
Channel 3: Royal Blue
Channel 4: Blue
Channel 5: Cyan
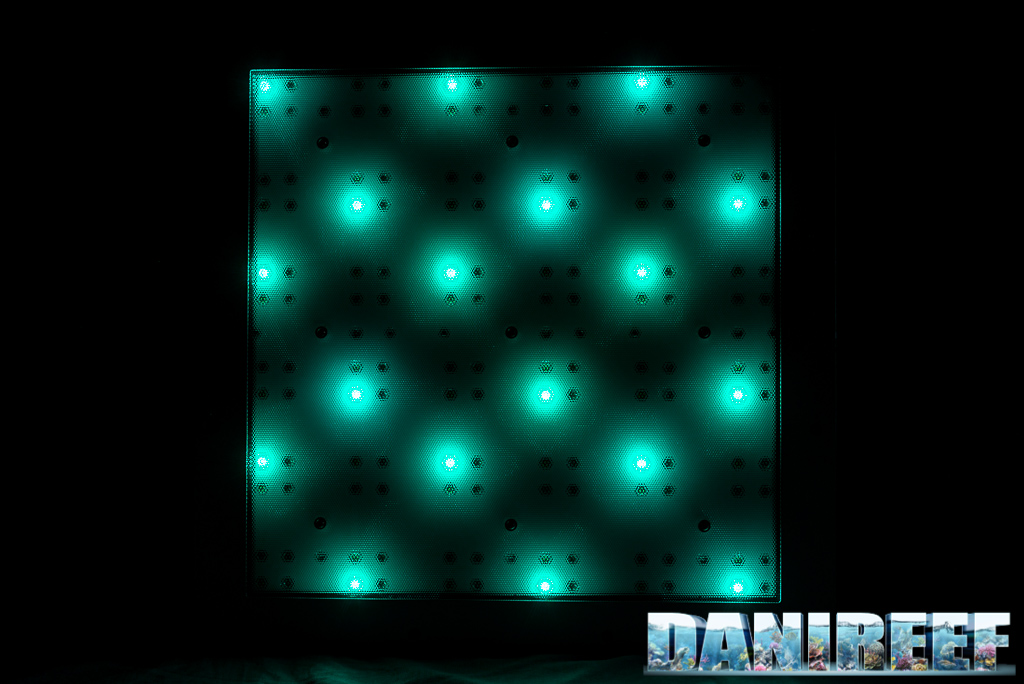
Channel 6: White
Channel 7: Red
Our new method: DaniReef LAB for PAR measurement of the ATI Straton
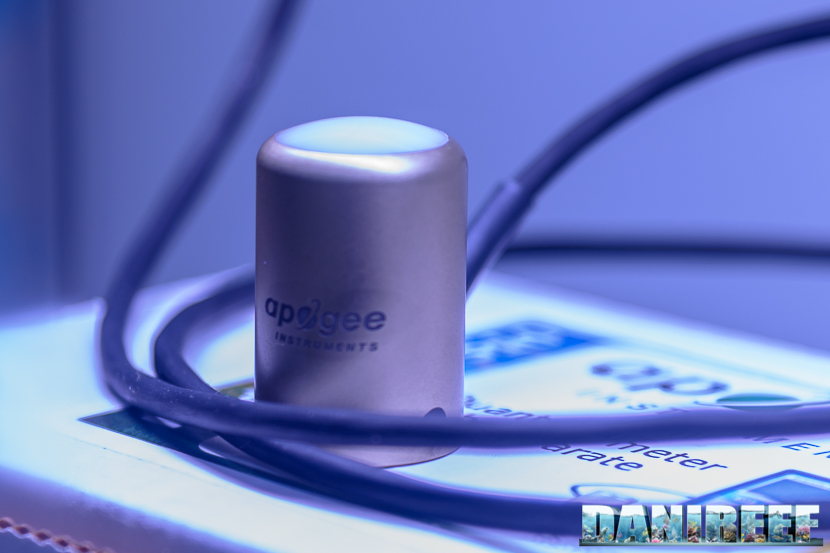
Antefact: (this paragraph is the same for each ceiling light measured with our DaniReef Lab for explaining the working method) During the long nights spent on our forum we always wondered how we could compare PAR from different ceiling lights. Even though we had the perfect device, the Quantum Meter MQ-510 di Apogee, we always referred to the value measured at the center at 20 cm of distance, more or less.
The Quantum Meter MQ-510 measures the PAR, expressed in PFFD: photosynthetic photon flux density in μmol m-2 s-1. This device is calibrated to work underwater, so if it’s in air the measured value has to be divided by 1.32, the dive factor. We have to do the conversion. The values you’re going to see are correct.
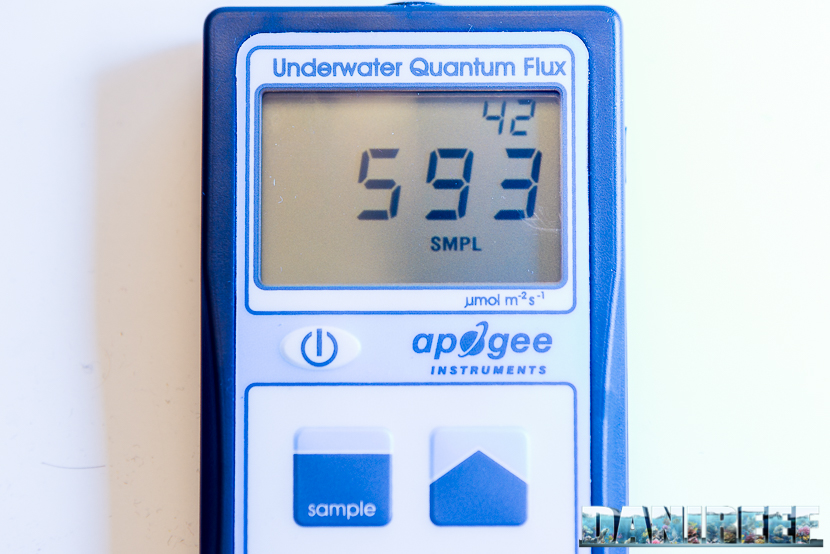
We decided to make a square base of 70×70 cm, and then we plotted 17 fiducial points where we placed the sensor Quantum Meter MQ-510 and we also made 3 lifts of 20, 40, and 60 cm for the ceiling light, in order to have the same distance from the sensor. This will allow us to create the curves which can be compared to other ceiling lights’, all tested at the same distances. This is the distance between the base of the sensor and the ceiling light. In reality it should be decreased of 3.5 cm, which is the height of the measurement cylinder, and increased by 0.5 cm, which is the dimension of the spacers that lift the ceiling light.
In total the three measurements are made from 17, 37 and 57 cm of distance. Because they were done in air they will be corrected.
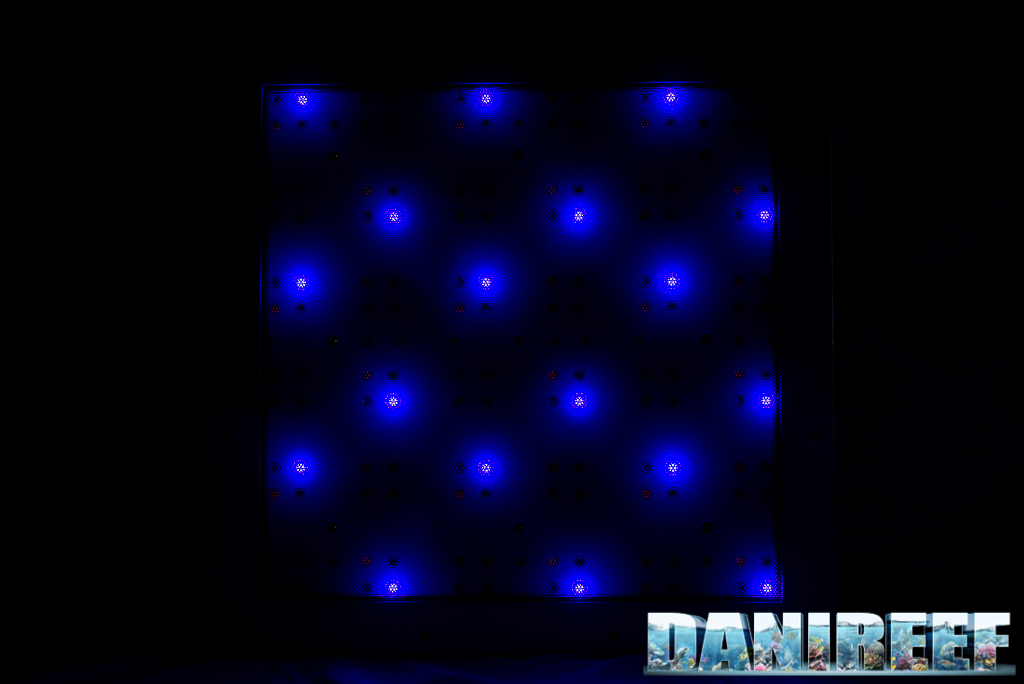
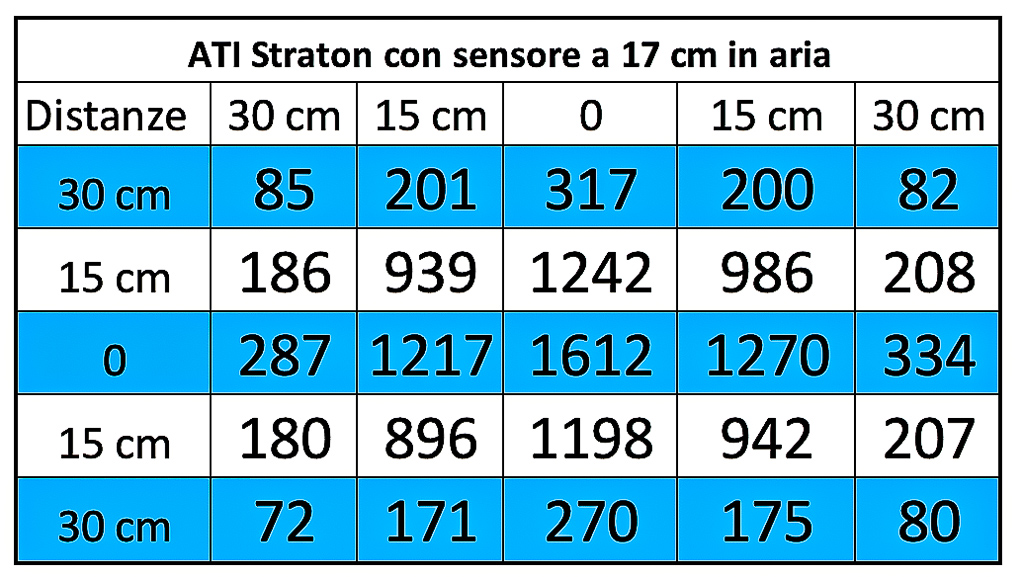
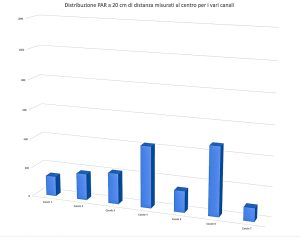
PAR measurement from 17 cm of distance
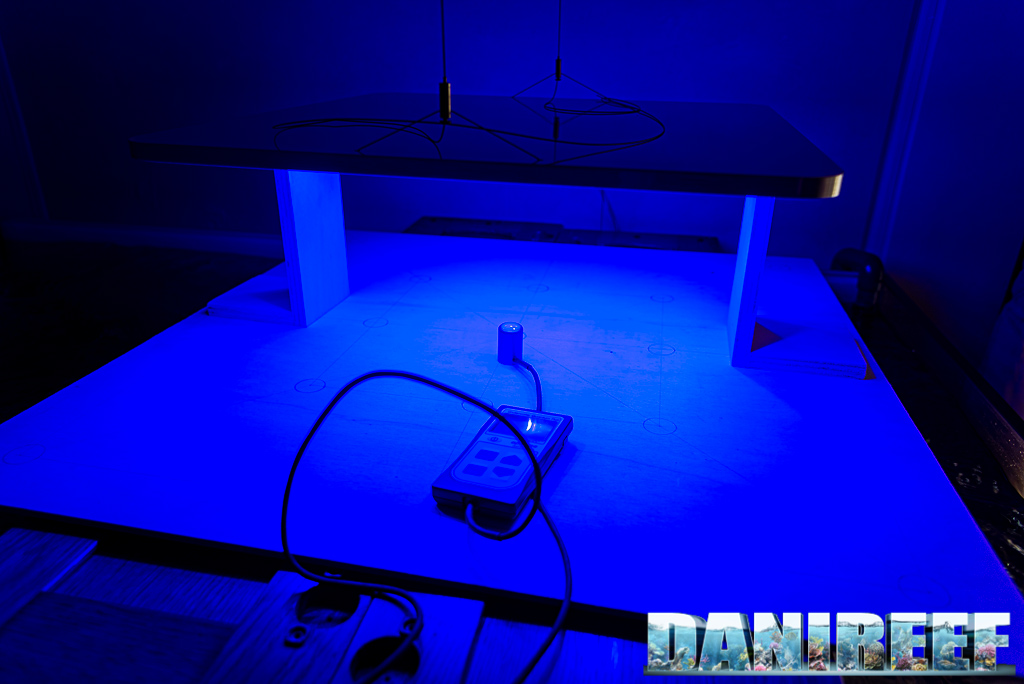
The ceiling light has been placed on wood holders. The points that weren’t on the board have been counted in the following chart.
These are the collected values:
And this is the corresponding chart, we came back to the classic scale in ortder to compare similar ceiling lights.
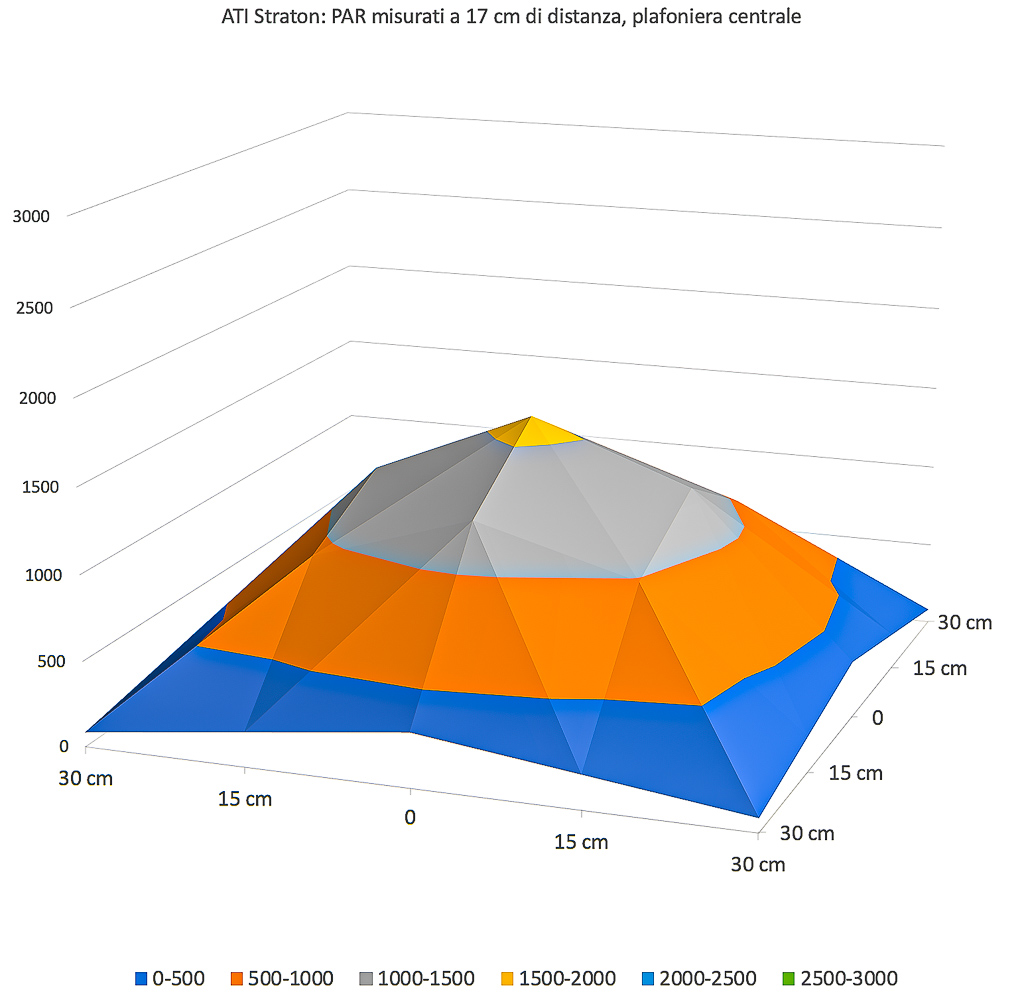
The first measure considers a small distance between the ceiling light and the sensor. For this ceiling light we can see that the difference in the middle and on the sides is very low. Small peak power, but great coverage. In line with what we could imagine from the design of the ceiling light. Remember that the ceiling light measures 46×41 cm while our area is 60×60 cm.
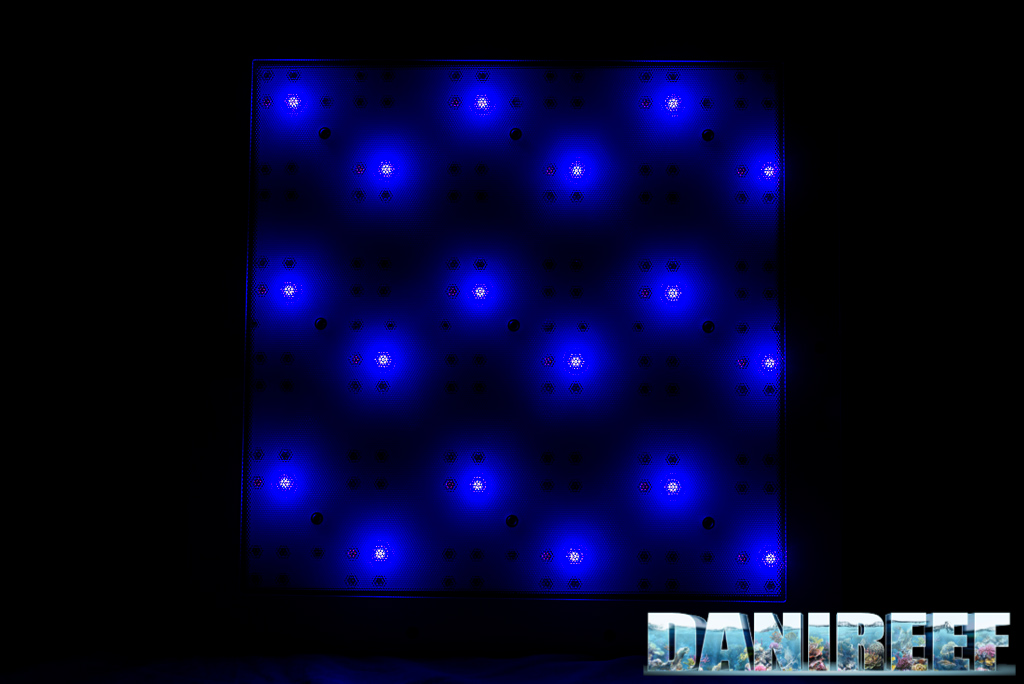
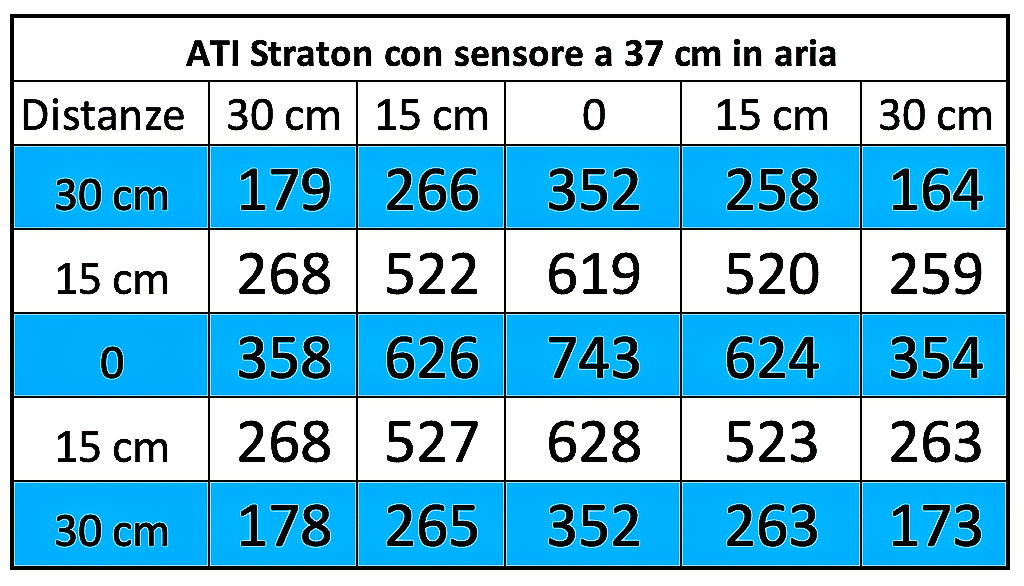
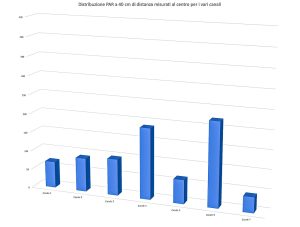
PAR measurement from 37 cm of distance
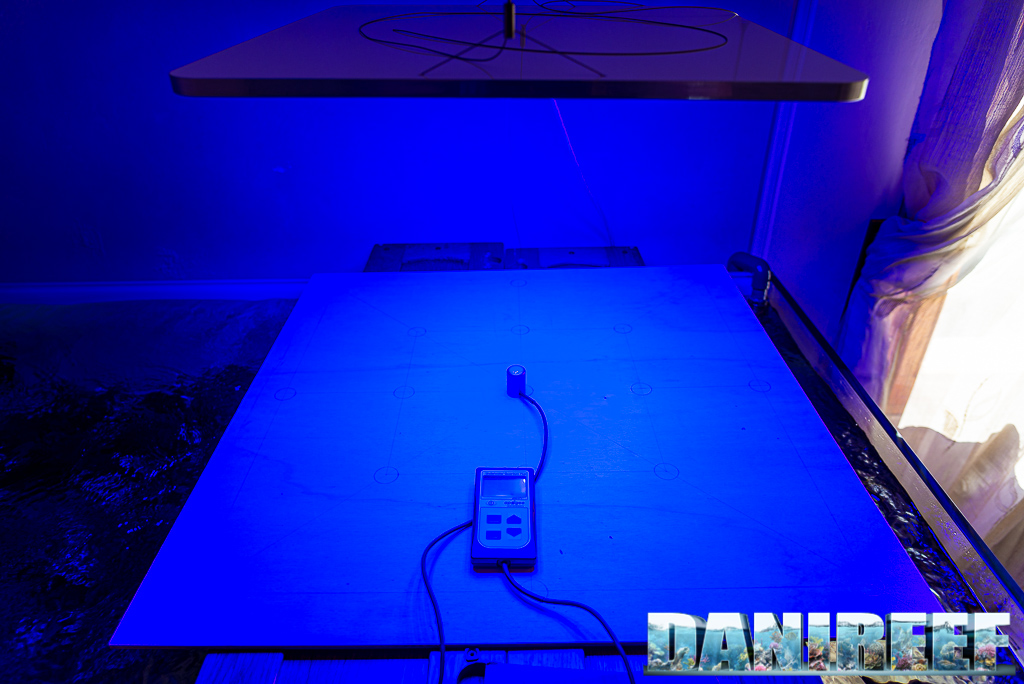
In this step we adopted a distance of 37 cm.
Here are the collected values:
And the corresponding chart:
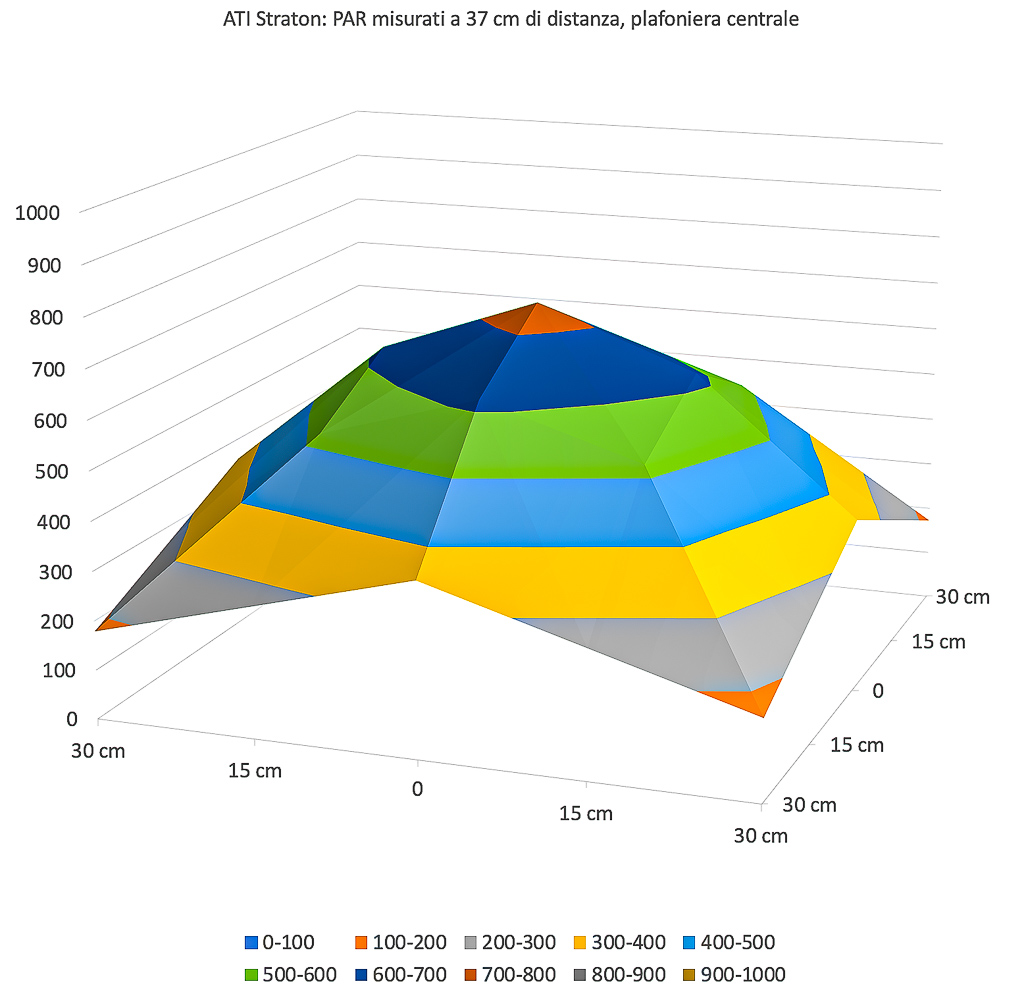
Increasing the space between sensor and ceiling light, the curve is even more complete. It decreases on the side more that we expected, maybe. The value in the middle decreases from 1612 to 743 μmol m-2 s-1.
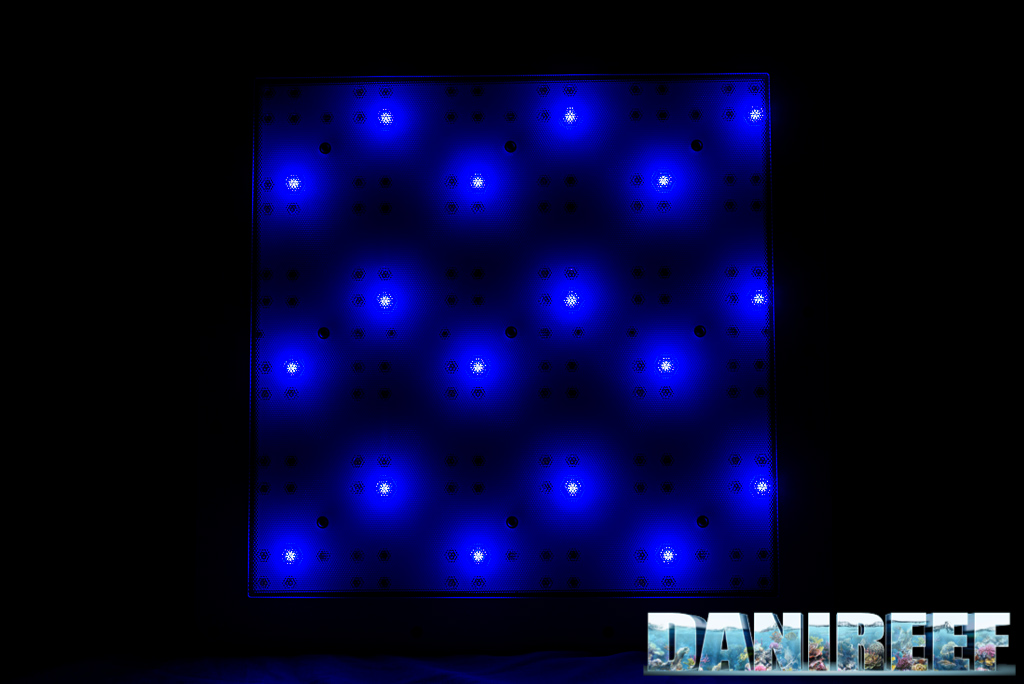
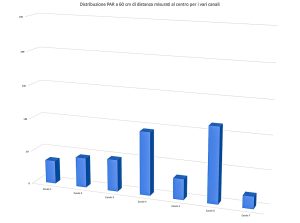
PAR measurement from 57 cm of distance
Finally, we adopted the distance of 57 cm.
Here are the collected values:
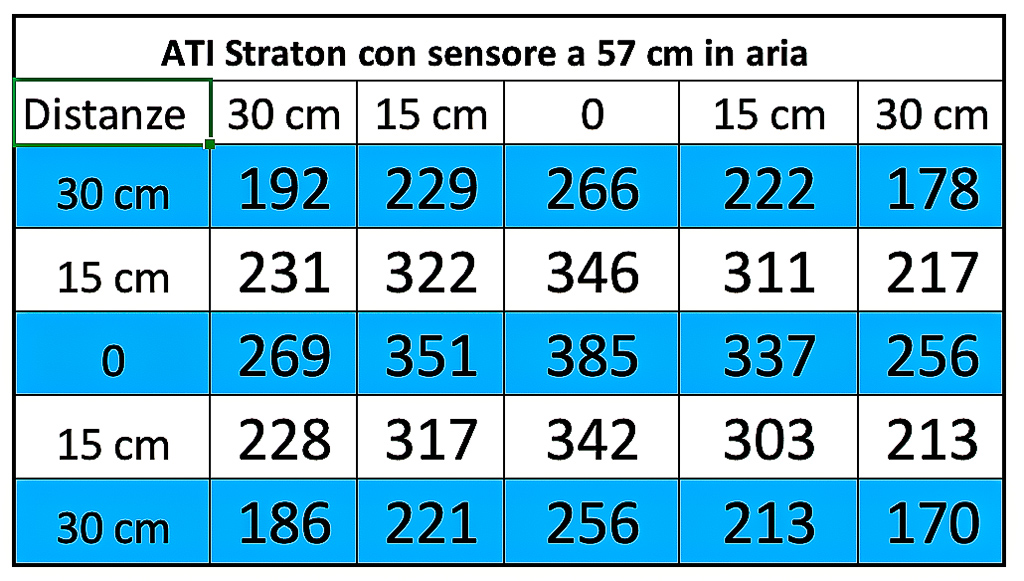
And the corresponding chart:
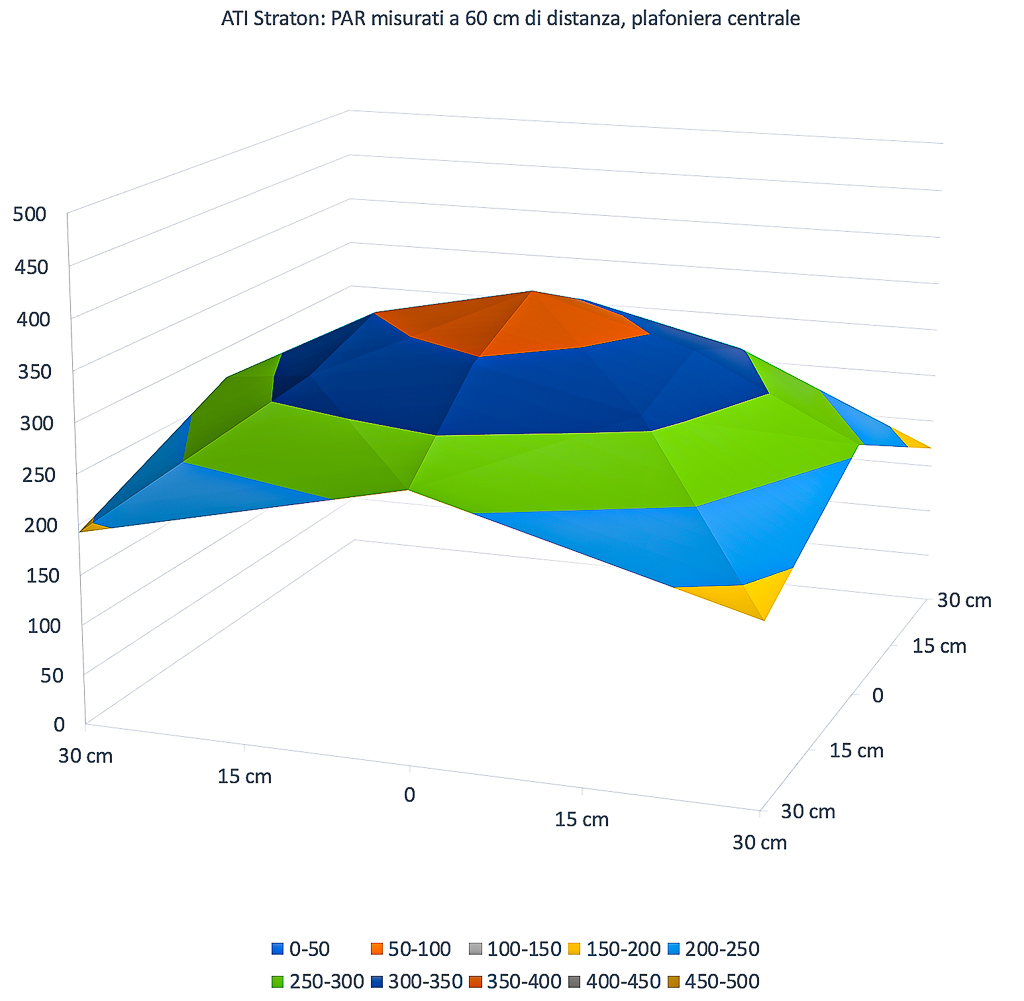
With a bigger distance between ceiling lights and sensor, the difference decreased between the PAR in the middle and on the sides. There’s more uniformity, but the total power decreases. The light spreads, but the central value decreases from1612 to 743 to 385 μmol m-2 s-1.
It stands out that the covering is completely uniform.
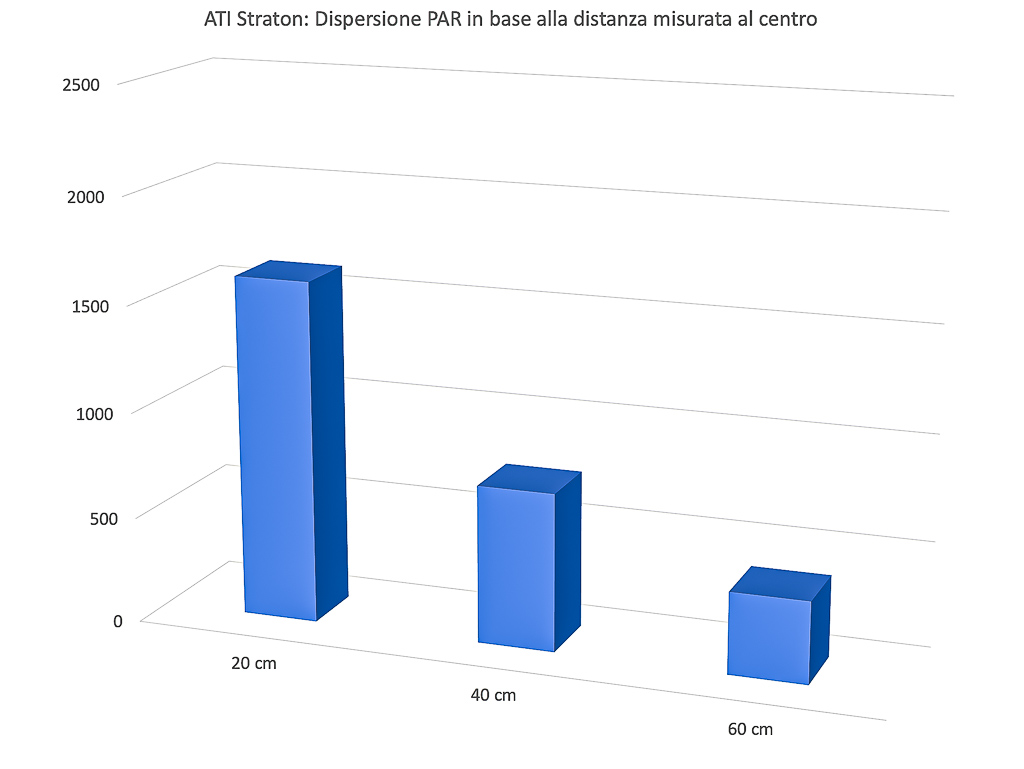
The PAR in the middle in the different configurations
Let’s continue with our technical measurements. We can see how, in a chart, the PAR collected in the middle decrease in the three different distances of the tests.
Energy variation of the ATI Straton depending on the distance
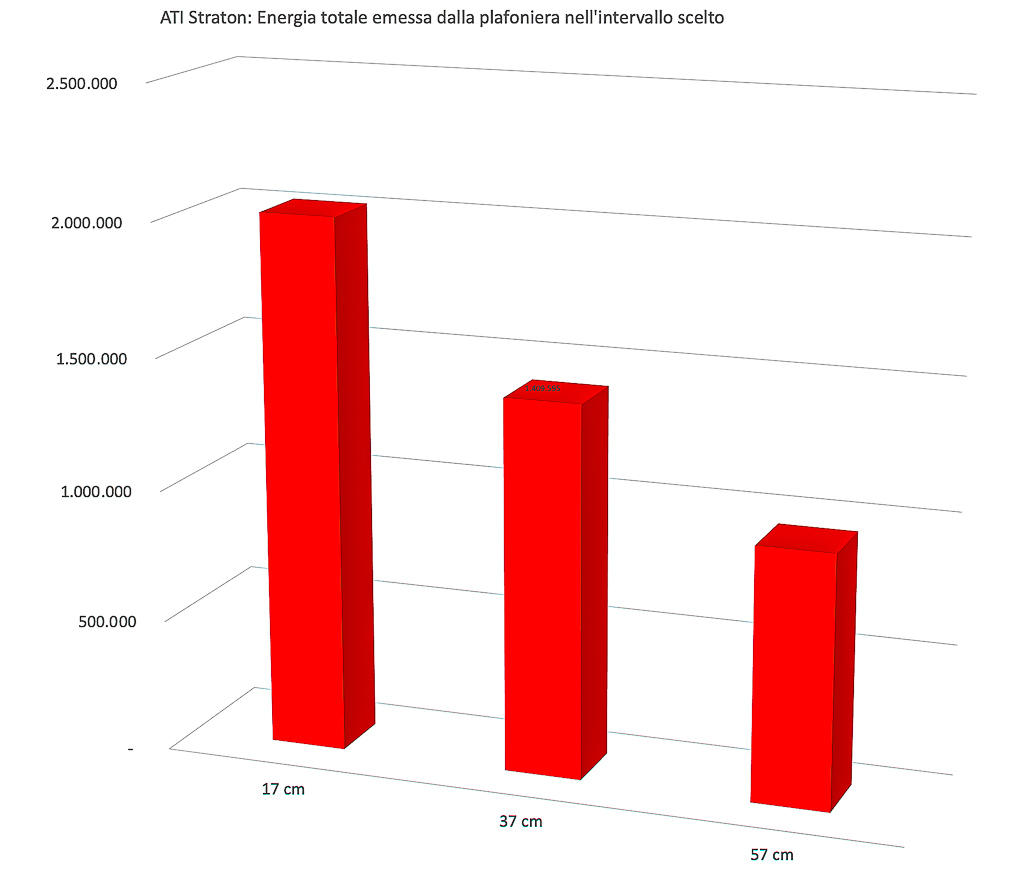
This is the most significant and most comparable data. The energy variation. We calculated the volumes of the three surfaces previously seen. Moving away from the ceiling light the PAR decreases, but the light illuminates a wider space. We try to consider all the light energy in this square of 60 cm under the bar. And it’s clear that the three values of 1,333,430; 920,227 and 631,087 assume a different connotation compared to the values in the middle. When the first ones are low because the distance is high, the subtended area, that is the energy, decreases less, because the “main part” of the lighting is in the middle. This is the theory. But the ATI Straton have a linear decrease of energy, because the LEDs are more spread out.
Looking at the values of the three curves, it’s noticeable that there is much more light towards the edges at 57 cm than at 37 cm or at 17 cm.
Value in the middle for each channel at three distances
We also measured the value in the middle of each channel in order to give you an idea of the contribution of each channel to the PAR.
Here are the collected values:
| Distance = 17 cm | Distance = 37 cm | Distance = 57 cm | |
| Channel 1 UV | 136 μmol m-2 s-1 | 70 μmol m-2 s-1 | 35 μmol m-2 s-1 |
| Channel 2 V | 179 μmol m-2 s-1 | 89 μmol m-2 s-1 | 45 μmol m-2 s-1 |
| Channel 3 Royal Blue | 208 μmol m-2 s-1 | 96 μmol m-2 s-1 | 48 μmol m-2 s-1 |
| Channel 4 Blue | 417 μmol m-2 s-1 | 187 μmol m-2 s-1 | 95 μmol m-2 s-1 |
| Channel 5 Cyan | 145 μmol m-2 s-1 | 63 μmol m-2 s-1 | 31 μmol m-2 s-1 |
| Channel 6 White | 466 μmol m-2 s-1 | 222 μmol m-2 s-1 | 113 μmol m-2 s-1 |
| Channel 7 Red | 90 μmol m-2 s-1 | 41 μmol m-2 s-1 | 18 μmol m-2 s-1 |
-
- 17 cm
-
- 37 cm
-
- 57 cm
The two channels that contribute the most to the PAR emission of the ceiling lights are Blue and White. White and Blue alone have 883 μmol m-2 s-1 when the other 5 channels together have 758 μmol m-2 s-1. That means that two channels make the 54% of the total.
Consumption
The measurement of the consumption was made possible thanks to the useful RCE PM600 that can also measure the Cos(fi) (or power factor). The result is given in watts.
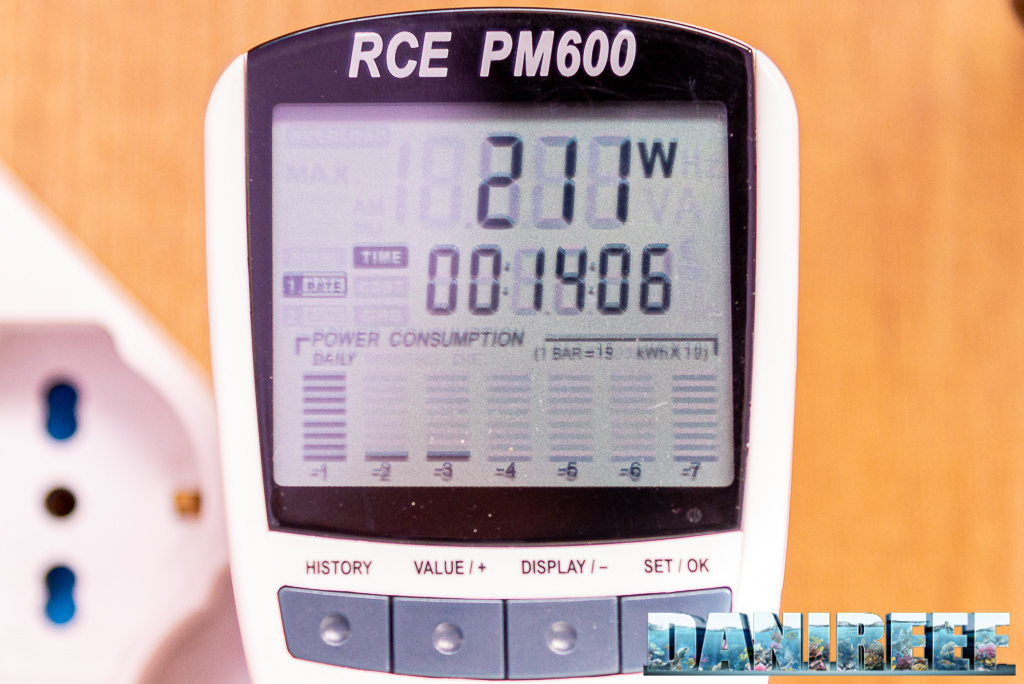
Pictured above is the maximum power, and below is the Cos(fi).
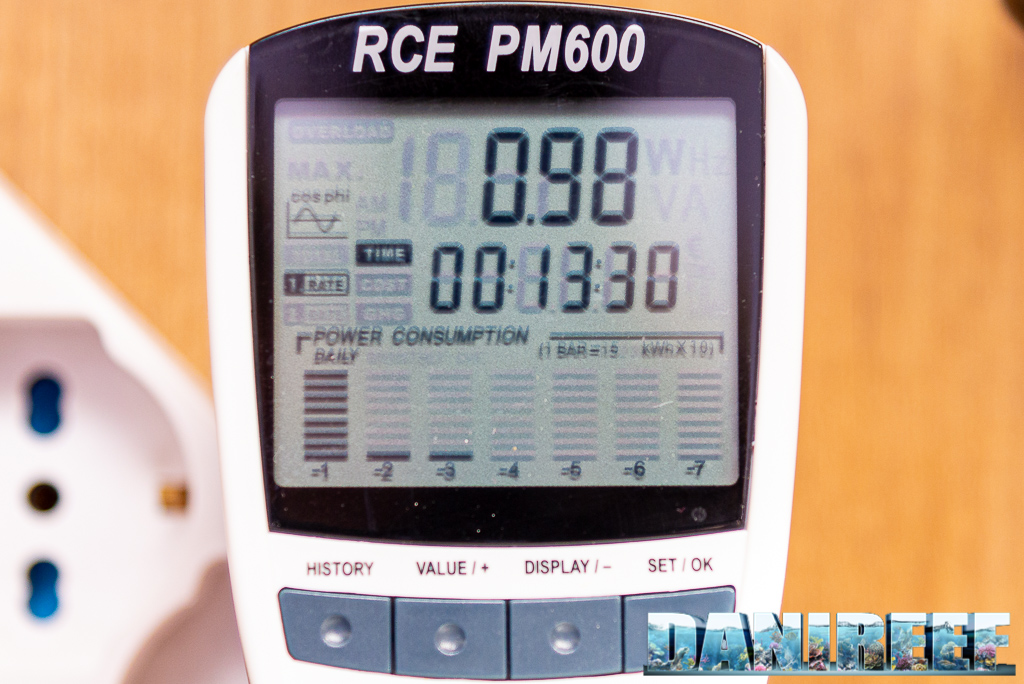
The ATI Straton ceiling light consumes 211 watt. Considering that at 17 cm the ceiling light has in the middle 1612 μmol m-2 s-1, we know that it will have a peak value of 7.64 μmol m-2 s-1 w-1 (PAR per watt).
The electric consumption is lower that declared, by 8%. We measured this value many times, on both the ceiling lights we had. We were more interested in the PAR than in the closeness to the data. We wanted to understand what we can breed with this ceiling light.
The ceiling lights heat up, we read in the app 52-53 degrees Celsius (125-127 F) , and consider that at 55 degrees C (131 F) in theory the ceiling light should start to dim its channels. You’ll discover if it’s enough very soon.
How to value these numbers in aquarium?
This is a good question. At first we thought that we could transport these values to the aquarium tout-court. Than we filled the aquarium, inserted the probe, and redid the measurements. We fazed but, as we have already said, we’re going to talk about that in another article. Basically, while at 20 cm the result is practically the same; as we progressed, thanks to the glass and the water itself reflecting the light, we found up to double the values measured in air. Obviously this isn’t a detail that can be standardized, so we think that our method of calculation is the most correct, and the best for the comparison of coverages of different ceiling lights.
The comparison with other ceiling lights on the market
Recently we started to use the new Apogee’s Quantum Meter MQ-510. Because of this, we can’t perfectly compare the data of the other ceiling lights, because before now, we used the probe Seneye.
| Energy | Cost | Consumption | Energy/€ | Energy/w | |
| AI Hydra 32 HD at 17 cm | 560.000 | 430 | 90,50 | 1.303 | 6.190 |
| AI Hydra 32 HD at 37 cm | 563.000 | 430 | 90,50 | 1.310 | 6.224 |
| AI Hydra 32 HD at 57 cm | 463.000 | 430 | 90,50 | 1.076 | 5.112 |
| Aqamai LRM at 17 cm | 643.000 | 465 | 90,88 | 1.382 | 7.071 |
| Aqamai LRM at 37 cm | 722.000 | 465 | 90,88 | 1.552 | 7.941 |
| Aqamai LRM at 57 cm | 616.000 | 465 | 90,88 | 1.326 | 6.783 |
| Aqamai LRS at 17 cm | 276.000 | 289 | 47,59 | 955 | 5.797 |
| Aqamai LRS at 37 cm | 312.000 | 289 | 47,59 | 1.078 | 6.547 |
| Aqamai LRS at 57 cm | 254.000 | 289 | 47,59 | 880 | 5.343 |
| ATI Straton at 17 cm | 2.018.232 | 890 | 211 | 2.268 | 9.565 |
| ATI Straton at 37 cm | 1.409.595 | 890 | 211 | 1.584 | 6.681 |
| ATI Straton at 57 cm | 957.209 | 890 | 211 | 1.076 | 4.537 |
| Cetus 2 at 17 cm | 410.000 | 215 | 60,68 | 1.906 | 6.756 |
| Cetus 2 at 37 cm | 291.000 | 215 | 60,68 | 1.353 | 4.793 |
| Cetus 2 at 57 cm | 174.000 | 215 | 60,68 | 807 | 2.861 |
| Orphek OR2 Blue Plus 120 cm at 17 cm | 323.000 | 180 | 54,69 | 1.794 | 5.906 |
| Orphek OR2 Blue Plus 120 cm at 37 cm | 291.000 | 180 | 54,69 | 1.616 | 5.321 |
| Orphek OR2 Blue Plus 120 cm at 57 cm | 259.000 | 180 | 54,69 | 1.438 | 4.736 |
| Orphek OR2 Reef Day Plus 120 cm at 17 cm | 255.000 | 180 | 54,69 | 1.418 | 4.667 |
| Orphek OR2 Reef Day Plus 120 cm at 37 cm | 233.000 | 180 | 54.69 | 1.292 | 4.252 |
| Orphek OR2 Reef Day Plus 120 cm at 57 cm | 225.000 | 180 | 54.69 | 1.251 | 4.117 |
| Philips CoralCare at 17 cm | 1.859.000 | 749 | 190,50 | 2.481 | 9.756 |
| Philips CoralCare at 37 cm | 1.341.000 | 749 | 190,50 | 1.790 | 7.037 |
| Philips CoralCare at 57 cm | 933.000 | 749 | 190,50 | 1.246 | 4.899 |
The energy per watt is less than the comparable Philips Coralcare, but the maximum value is higher. They have similar energy, even taking into account 20 watts less for the consumption of the Philips. This probably depends on the specific LED. The economic efficiency is slightly less than the Philips. In any case, they are respectable values. And for now it has the record of energy produced.

Maintenance costs
The ATI Straton costs 890 euro ($1057 USD).
The absorbed power is 211 watt, so the relationship cost/watt is 4,22 euro for each watt. You can consult the following chart for the comparison with other ceiling lights. Notice that they’re in order of decreasing efficiency, so the best ones are on top.
| Ceiling light | Price | Consumption | Relationship euro per watt | References |
| Orphek OR2 Blue Plus | 180 USD | 54,7 w | 3,3 euro per watt | DaniReef LAB |
| Orphek OR2 Reef Day Plus | 180 USD | 54,7 w | 3,3 euro per watt | DaniReef LAB |
| Cetus 2 | 215 € | 60,7 w | 3,5 euro per watt | DaniReef LAB |
| Philips CoralCare 2019 | 749 € | 190 w | 3,9 euro per watt | DaniReef LAB |
| Maxspect Ethereal | 500 € | 126 w | 4,0 euro per watt | Italian test |
| ATI Straton | 890 € | 211 w | 4,22 euro per watt | DaniReef LAB |
| Radion XR30w G2 PRO | 790 € | 170 w | 4,7 euro per watt | Italian review |
| AI Hydra 32 HD | 430 € | 90,5 w | 4,75 euro per watt | DaniReef LAB |
| Radion XR30w G4 PRO | 915 € | 190 w | 4,84 euro per watt | Italian article |
| OceanLed Sunrise 600 | 870 € | 180 w | 4,8 euro per watt | Italian test |
| Orphek Atlantik V4 | 1099 € | 226 w | 4,9 euro per watt | Test |
| Radion XR30w G2 | 690 € | 140 w | 4,9 euro per watt | Italian review |
| Radion XR30w G4 | 760 € | 150 w | 5,1 euro per watt | Italian article |
| Aqamai LRM | 465 € | 87,5 w | 5,1 euro per watt | DaniReef LAB |
| Zetlight UFO ZE-8000 | 500 € | 91,5 w | 5,5 euro per watt | Test |
| Aqamai LRS | 289 € | 47,6 w | 6,1 euro per watt | DaniReef LAB |
| CEAB Slide & Led | 2.700 € | 275 w | 9,8 euro per watt | Review |
| Sicce GNC 466 | 1.592 € | 120 w | 13,3 euro per watt | Review |
The ceiling light is extremely well built, firm and solid. Very beautiful. The energy efficiency is high and the cost per watt is rather low. The values are perfect for nanoreefs and for aquariums up to 70 cm per side, for breeding SPSs and for every other animal. As the size of the aquarium increases, the coverage decreases, so I suggest 2 of these ceiling lights for 120 cm and 3 for 180. The energy is linear in the water column.
Questions and comments, as always, are welcomed. [Translated by Agnese Poggi]


Why does the energy variation bar chart say Philips coral care?
Sorry my fault. Because I use the same trace to write the articles. I correct now.