

This article has a not very fun or uplifting topic; death, specifically the mortality rate of fishes in captivity. A prominent zoo biologist once said, “The mortality rate for any animal in a zoo [captivity] is 100%”. Of course, this statement was designed to get people to understand that the term “mortality rate” is a function of the number of deaths in a population over time. If the time span is beyond the animal’s maximum life span, then the mortality rate would obviously be 100%. The converse is also true, examining the mortality rate of a group of captive animals, in which a portion of the population is still alive is very difficult. For example, if you have a population of 100 fish in captivity and 10 of them die in one year, the mortality rate may not be 10% per year (as might be imagined) because the remaining 90% of the fish are still alive, and since they have yet to die, you do not know for certain if the mortality rate will increase or decrease for the next and subsequent years.
Try to think of this topic as a necessary evil, to truly understand the living aquatic animals in our care, we need to also be able to monitor and control their mortality as best we can. All aquarists will lose animals; some will lose more than others. This mortality can be managed by preferentially acquiring certain species while avoiding others. Examining the mortality rate of fishes in captivity can also offer insight into the relative ability of the available husbandry methods to support aquatic life. Some new aquarists have unrealistic expectations of the mortality rates of their fishes. It is probable, that as new aquarists, their fish will experience a higher than normal mortality rate, yet even a few fish losses early on, can cause some of them enough frustration that they soon leave the hobby. One unconfirmed report from the 1980’s stated that the average length of time that a person stayed in the marine aquarium hobby was about nine months – due in large part to
uncontrolled mortality rates.
This article speaks mostly to the mortality rate of captive fishes. Certainly, invertebrates experience mortality in captivity, but less is known about their natural longevity. The issue with invertebrates is further complicated by colonial invertebrates, where part of the colony may die, but the aquarist is able to take a cutting of a healthy portion and start a new colony – how do you then predict these “partial mortality” events? Cephalopods are invertebrates with better known life spans – always shorter than the aquarist would like, but that is due to their naturally short life spans. European cuttlefish tend to survive less than 15 months; tropical banded octopus may live less than one year, while the giant Pacific octopus lives around three years in captivity.
Mortality rates of captive fishes can of course be influenced by how they are handled during collection and shipping, before they even reach the end-consumer. The Hass’s garden eel, (Heteroconger hassi) is the most commonly seen garden eel, and probably the hardiest, yet the mortality rate for garden eels casually placed into standard fish-only or mini-reef systems will be virtually 100% in the first six months. Even public aquariums may commonly experience mortality rates of over 75% during the first year with this species, yet well-acclimated fish can then live on for dozens of years (Hemdal 2006). The condition of the animal upon its arrival is vitally important. If the eel has been languishing in a dealer’s aquariums for many weeks, (possibly being held in a small container so that it cannot burrow) it may be suffering from subsequently fatal malnutrition (Hemdal 2007). One group of Hass’s garden eels imported from a dealer in Japan (where they had been kept in a deep sand tank and acclimated to captivity prior to sale) did much better, with a mortality rate of around 30%, despite having been shipped from Japan to the United States.
Mortality displacement describes a shift in mortality rate over time in a given population due to some known environmental problem such as a disease outbreak or water quality problem. During a disease outbreak for instance, there is often an excess mortality rate in the population, affecting susceptible animals. Afterwards, there may a corresponding decrease in the mortality rate as the already compromised animals have died during the episode. This is morbidly sometimes referred to as the “harvesting effect”. This “harvesting” is usually of animals that would have soon died from some other problem. If the disease outbreak is acute and uncontrolled, there may be no remaining animals in the population.
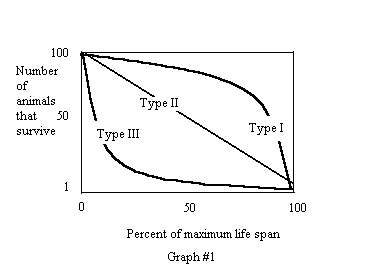 Survivorship: In addition to “mortality rates”, populations of animals can be categorized as to the type of survivorship normally seen. Survivorship is defined as the percentage of offspring that survive to a given age. There are three basic trends in survivorship, Types I, II, and III. Graph number one outlines these three trends.
An example of a Type I animal would be human beings. Most people survive well past their normal reproductive years, and then tend to die of old age as they reach their maximum life span. Type II animals would have a constant mortality rate throughout their normal life span. Examples of this would be seen in sea anemones that reproduce by fission, where the two split anemones would be expected to each be as likely to die as the other since predation would be expected to be relatively constant. The type III animals include many aquarium animals that produce large numbers of young. High mortality rates are often seen in larval fishes, but once they reach a certain age, the mortality rate levels off. It is vital for home aquarists to understand these trends (Hemdal 2003).
Longevity in captivity: You need to be concerned with mortality rate over the animal’s normal captive lifespan (not its longevity in the wild as this is impacted by predation, which should not be occurring in your aquariums). Are your animals living as long as they should? Most small fish have captive life spans of three to five years. Medium to large marine fish generally are capable of living more than ten years in captivity. Table 1 list some normal aquarium specimen life spans for which there are confirmed records.
| Fish | Life Span |
|---|---|
| Black tip reef shark | 20 years (still alive) |
| Clark’s clown | 8y 4m |
| Cuttlefish | 13 months |
| Deep sea isopod | 8 years |
| Diamond butterflyfish | 12 years |
| Giant Pacific Octopus | 27 months |
| Leptogorgia sp. | 16 years (cuttings 20+ total years in captivity) |
| Marsh killifish | 4 ½ years |
| Neon goby | 4 ½ years |
| Photoblepharon flashlight fish | 16 years (still alive) |
| Ocellaris clownfish | 4y 3m |
| Orbicularis batfish | 18 years |
| Slipper lobster | 8 years |
| Sailfin tang | 12 years |
| Squirrelfish | 10 years |
| Tiger cowry | 7 years 3 months (acquired as an adult) |
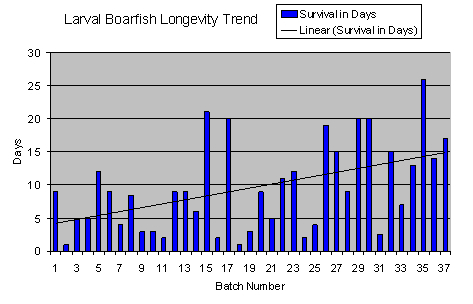
Figure 2: Longevity in days of 37 batches of larval boarfish (Capros aper).
Case Histories
The following are some examples of how mortality rates can be used to study some particular aspect of aquarium husbandry more closely. These data were collected at a public aquarium, but still have application to home aquariums and the pet industry in general. Certainly people who work with living fishes develop a comfort level regarding mortality rates, which if exceeded, makes them feel ill at ease (and hopefully to search for a way to reduce the rate). However, this “gut feeling” is such an imprecise monitoring method that aquarists working with large numbers of fish under different conditions really must monitor mortality rates in order to gain a clear picture of how well the fish are doing.
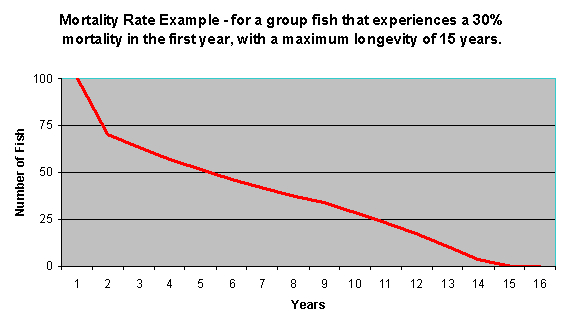
Figure 3: This is a hypothetical graph showing the number of fish remaining in a population that has a high 30% mortality the first year (due to capture and transport stress, etc.) followed by a slower decline over the ensuing years until the maximum lifespan of 15 years is approached.
This graph lists the longevity (in days) of 37 batches of larval boarfish (Capros aper) that were attempted to be raised by a public aquarium. As variables in the rearing conditions were changed, the mortality rates for each batch of larva changed as well. The thin sloping black line shows the overall trend in survival time. In this case, it is gradually sloping upwards, indicating that the aquarists are on the right track regarding the needs of these larvae in captivity. What isn’t shown on this graph is that there was a 6 month hiatus between batch 17 and 18. The resulting dip in longevity at that point was due to having the “re-learn” some of the techniques that had made batches 15 and 17 so successful.
The data in this table is a bit more difficult to interpret. It shows the 60 day survivorship of 120 fish and invertebrates of three groups; 32 control fish selected by an experienced aquarist for hardiness and proper handling and collection methods employed (no fish from Indonesia or the Philippines) versus 68 fish and 20 invertebrates from a shipment confiscated by the USFWS from a pet store that all originated from the Philippines or Indonesia. These were specimens sometimes termed “grade B SE Asian” – basically, fish that are smaller than normal for the trade, coming out of Jakarta, Cebu or Manila. Shipments of these types have a high percentage of “junk” fish that few dealers want; cleaner wrasse, tiny ocellaris clowns, green chromis, clown sweetlips, 1.5″ bicolor angels, etc.
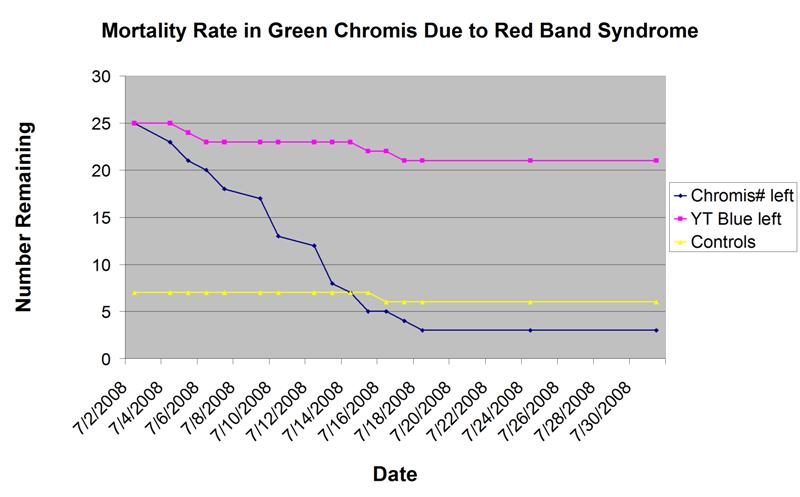
Figure 4: This chart shows the mortality rate of three groups of fish in the same holding system: two groups of newly imported damselfishes against a group of controls in. Over the 30 day time frame, over 80% of the green chromis succumbed to red band syndrome (Uronema sp.). Only one control fish died, and the few yellowtail blue damsels that died were the result of aggression (Hemdal 2010).
The data shows that of these “grade B” specimens, 57% of the confiscated fish and 30% of the confiscated invertebrates died within 60 days. Only 12% of the hand-selected fish and none of the hand selected invertebrates died during the same period, and in the same water systems. This shows that early mortality in wild caught marine specimens can be mitigated by preferentially acquiring them from better quality sources, and by avoiding certain species known to do poorly in captivity.
Mortality rates seen in fishes kept in public aquariums
Public aquariums typically maintain very complete records of the fishes in their charge. Additionally, they offer their animals higher quality medical care than home aquarists can provide. This allows for the potential to use mortality rate data from public aquariums, as a benchmark for home aquarists. There are some potential obstacles in drawing a comparison such as this; many public aquarium fishes are larger species, which tend to be longer-lived. This may be balanced though, by the tendency for public aquariums to also acquire more delicate, exotic species having the potential to be shorter-lived. Public aquariums do understand that it is very easy for mortality rate information to be misconstrued, possibly putting them in a bad light. Think for example of a newspaper reporter hearing that the average annual mortality rate at an aquarium being 10%. They might write a headline stating “Aquarium Needs to Replace All of its Animals Every Ten Years!” Of course this isn’t true, and does not take into consideration fish in the collection that have a normal longevity of less than ten years. Truly, the only real way to use captive mortality rates in anything other than a relative comparison is to express the rate as a percentage of normal longevity in the wild. In this case, since captive fish are not (or hopefully not) exposed to predation as they would be in the wild, the captive mortality rate will be lower than the rate in the wild.
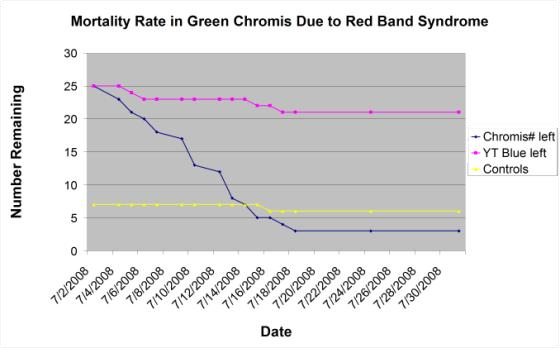
Figure 5: Red Band Syndrome affects on Green Chromis mortaility rates.
Just as an example, the mortality rate of post-quarantine fish had been monitored on a monthly basis at a medium-sized public aquarium for the past 20 years. The mortality rate they use is calculated by multiplying the number of animals dying in one month by 100 and then dividing by the number of fish in the collection at that time. This gives the mortality rate for that month. That figure is then multiplied by twelve to give an extrapolated yearly figure – one that is easier for people to understand.
A long term departmental / curatorial goal for that facility has been to maintain a mortality rate of below 10% on an annualized basis, with an upper limit of 15%. In one instance, the monthly rate calculated to be 16.9%. This triggered a response that included changes in husbandry protocols and the type of fish being acquired. This in turn resulted in a lowering of the mortality rate to well below 10% annually – hovering between 6 and 8%. This figure might be used as a benchmark for intermediate and advanced home aquarists as well.
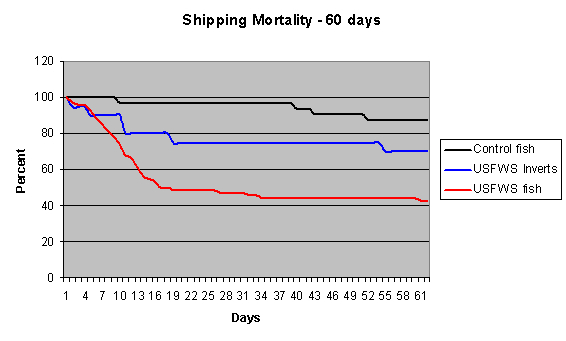
Figure 6
So Where is the Body Buried?
What is the end game for a lost specimen? Most people either flush deceased aquarium animals down the toilet, or put them out with the garbage. Both of these circumstances insure that the dead specimen will serve no further useful purpose. Giving the animal a cursory necropsy or preserving it may allow for additional benefit to be gleaned from it. If this information can then be used to decrease the mortality rate of the remaining animals, aquarists should always consider that option. Even without a microscope, the cause of death can be determined in a number of cases. Preserving specimens (using denatured ethanol rather than formalin) is one way to keep a deceased fish available for future study. If nothing else, the fish will serve as a reminder of the loss, and hopefully prompt the aquarist to do the best they can caring for their fish in the future.
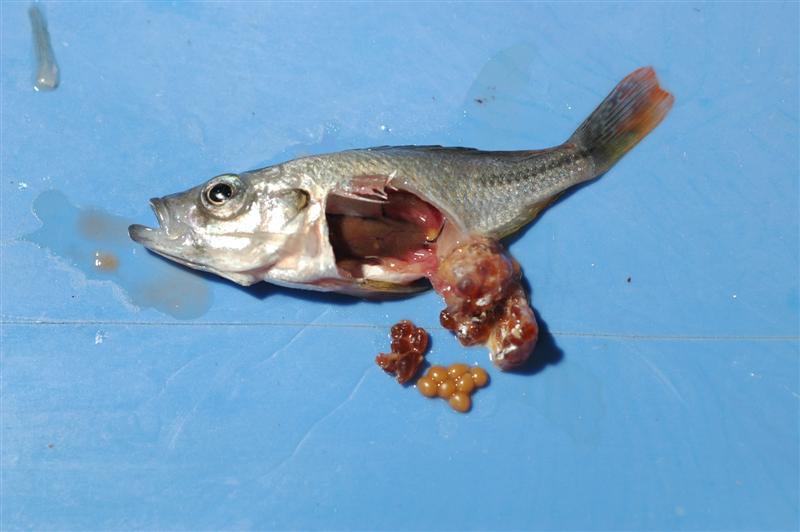
Figure 7: A female Haplochromis piceatus that was discovered to have succumbed to “egg binding” – something that the aquarist could not have prevented.
Conclusion
So how can aquarists best utilize the information presented here? First, it is obvious that unless you constantly monitor the mortality rates of the animals under your care, you have no way of knowing if your husbandry skills are improving. Second, this information should serve to reinforce the idea that taking animals from the wild and holding them in captivity carries with it an important responsibility.
On a personal note, while much of what I’ve written here is rather dry and clinical, please do not misconstrue and think that I don’t hold any empathy for my aquarium animals. While it is true that I avoid anthropomorphizing any of the animals in my charge, (excepting house pets) I do feel a deep responsibility for all of them. I am of course saddened when I lose a fish, but that sadness is not related to the cost or rarity of the animal, or my personal feelings about it, but rather the degree to which I know that I might have been able to offer it better husbandry. Mistakes can happen, and losses due to error make one feel the worse. To sum it all up:
“”If a captive fish shows no signs of chronic disease or abnormality, exhibits normal feeding and reproductive behaviors and most importantly, exhibits a normal lifespan compared to that of wild counterparts (minus the predation that wild fish incur), then there is no other metric we can use to determine if a certain suite of husbandry techniques are suitable or not.””
References
- Hemdal, J.F. 2010. Red Band Syndrome. Aquarium Fish International 22(1):26-30
- Hemdal, J.F. 2007. Chronic Anorexia in Aquarium Fishes. Advanced Aquarist’s Online Magazine. 6(12): http://www.advancedaquarist.com/2007/12/
- Hemdal, J.F. 2006. Advanced Marine Aquarium Techniques. 352pp. TFH publications, neptune City, New Jersey
- Hemdal, J.F. 2003. Aquarium fish breeding. 169pp. Barron’s Educational Series. Hauppauge, New York
0 Comments