

Purifying aquarium water with a protein skimmer represents one of the major strategies for maintaining water quality. This singular piece of equipment can often constitute the major set-up capital expense after the tank itself. With its presumably pivotal role in aquarium husbandry and its high price tag, it is no surprise that skimmer manufacturers strive to outdo one another with their exhortations and grandiose claims. For example, what aquarist can resist statements like:
Precision Marine:
“These skimmers will outperform anything in their class.”
“Our fractionators strip organics from the system quickly due to the high flow rates they are designed to operate.”
AETech (ETSS):
“This provides certain unique operational properties set it apart from the rest of the ETSS line. Giving your tank gentle but highly effective waste removal that will never over skim your aquarium. It creates the finest bubble size that totally fills the skimmer body with so much air that it turns the water to a solid milk color. The countercurrent action allows for far greater air water contact time and reduces the amount of wet foaming to a minimum.”
Euroreef:
“Custom modified pumps, “Euro-AirTM” venturis, and “Euro-WheelTM” pinwheel style impellers are combined to create that incredible volume of micro bubbles that provide the immense surface area resulting in unrivaled quick removal or organics resulting in a healthy aquarium.”
“The efficiency achieved with this design translates into higher performance at a lower operating cost to you!”
These statements, which are representative and certainly not unique amongst skimmer manufacturers, raise a series of questions:
- What is the factual basis for these claims?
- How do the skimmer manufacturers assay skimmer “performance”?
- Are there any metrics at all available to quantify skimmer performance?
- What does the concept of performance even mean when discussing skimmers?
In the article to follow, we present a new approach to addressing these questions. We will introduce concrete definitions for skimmer performance that focus on both the rate of organic contaminant removal and the extent of organic contaminant removal from saltwater. We then will introduce an experimental procedure, based on a model system, to measure these performance metrics for four representative skimmers. Finally, we will show how this model system accurately replicates skimmer performance with authentic aquarium water. We hope that these advances will prove valuable in the hands of forward thinking skimmer designers by providing the means to optimize skimmer performance as a function of both design variables and operational variables. Thus, it actually might be possible to provide, for the first time, unequivocal evidence in support of the claims of “best” so indiscriminately dispensed today.
What is Protein Skimming?
Water purification through skimming has been thoroughly reviewed in the aquarium literature (Holmes-Farley, 2006) and so the description of the basics will be brief. In essence, skimming involves introducing air bubbles into aquarium water, and then physically removing those bubbles after they have absorbed organic impurities. The mechanisms by which the bubbles are introduced, how they are mixed with the water, and how they are removed from the bubble/water mixture can be addressed by distinctly different engineering approaches, and these differences presumably constitute the basis for claims of “better” (or at least different) amongst the various skimmer manufacturers. The bubbles themselves are the key, as they provide an air-water interface that is particularly favorable for adsorption of certain kinds of organic molecules. Not all organic molecules are susceptible to this type of capture; in fact, only those molecules that have distinct hydrophilic (= water loving) and hydrophobic (= water hating) sub-regions attach tightly to this surface. The hydrophilic portion of the molecule remains in the water, but the hydrophobic portion is forced out of the water and into the air space of the bubble. The process is illustrated for the generic skimmer pictured in Fig. 1. This skimmer is fed aquarium water via a pump, and that water is mixed vigorously with small air bubbles at the inlet. These bubbles pass through the water in the skimmer body and absorb susceptible organic molecules as they transit up the column. The water in the skimmer body then exits back to the aquarium, less the removed organics. The bubbles, on the other hand, coalesce into a foam at the top of the water column, and their continuous replenishment at the bottom of the foam forces the top of the foam out over a riser tube and into a collection annulus. This foam carries with it an organic load, and physical removal of this organic-rich foam/residue/sludge completes the water purification process. In addition to some dissolved organics, small particulates and microbes (bacterioplankton, phytoplankton) can be removed at the air/water interface of the bubble as well (Suzuki, 2008). The skimming process does not remove atoms/molecules that are strictly polar and readily dissolve in water, such as some organics, salts, inorganic phosphate, carbonate, etc.
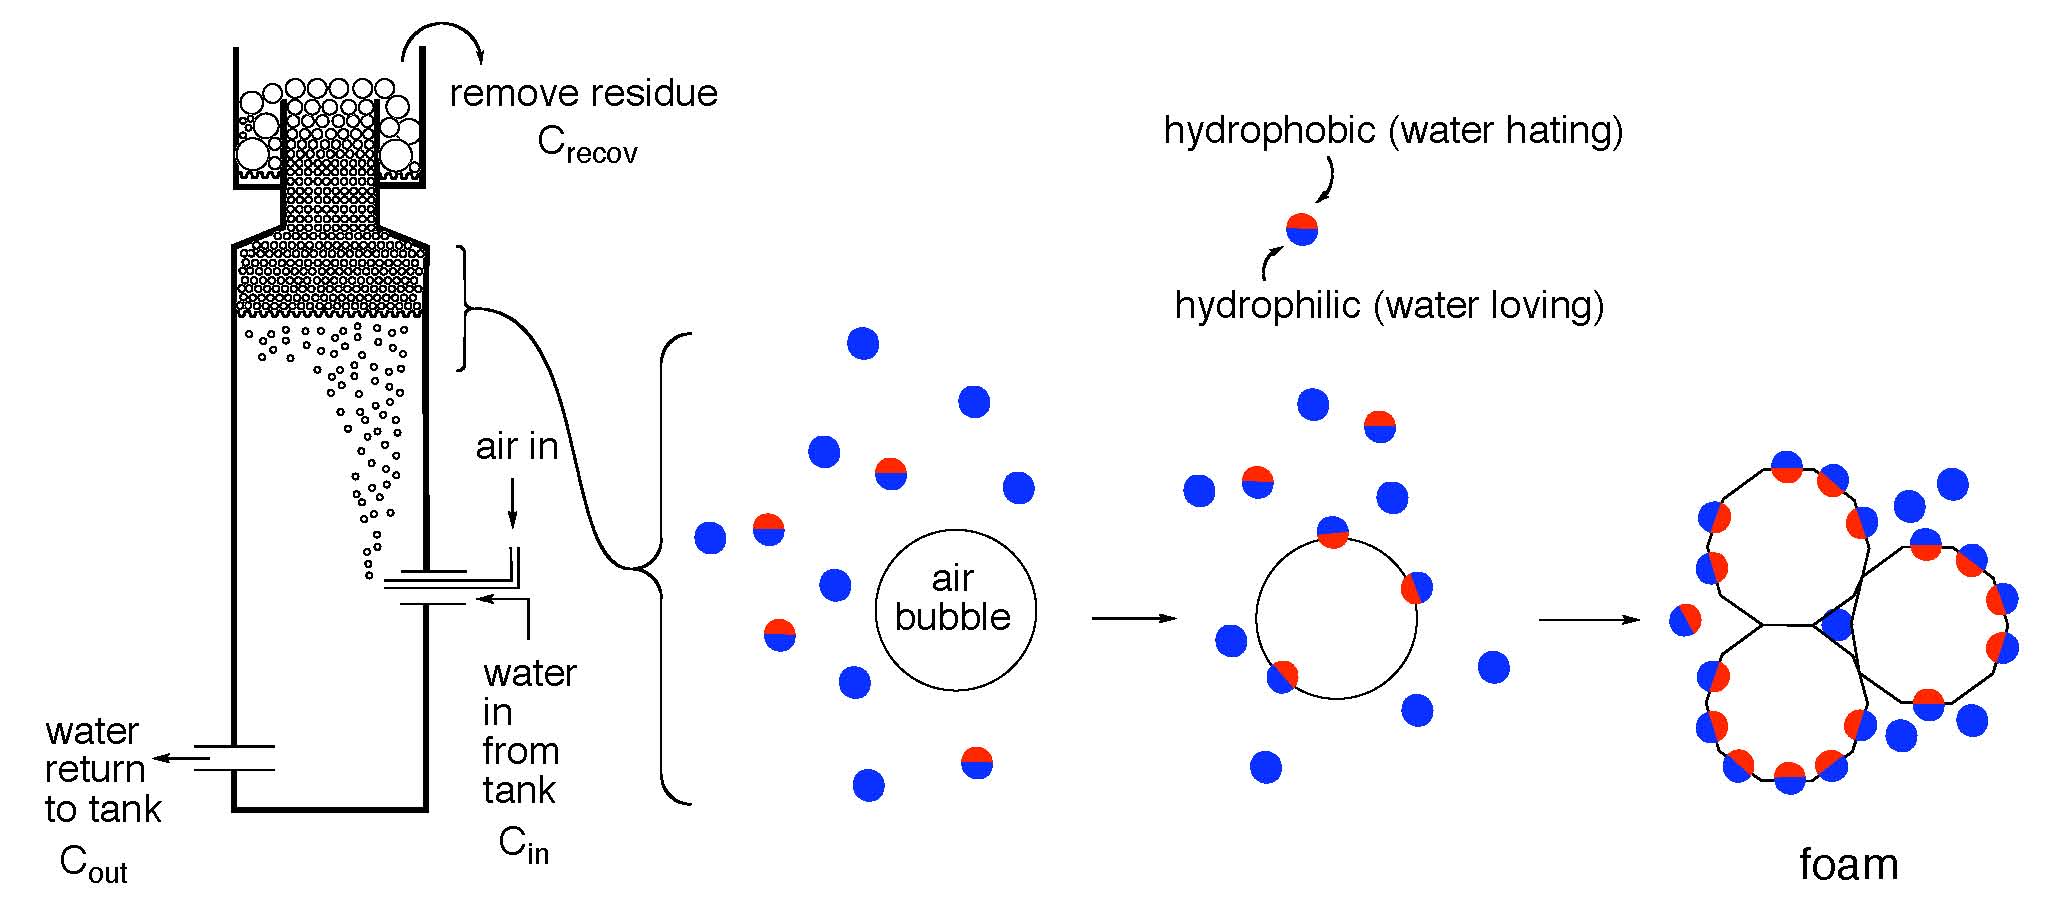
Figure 1. Schematic of the skimming process.
History of Protein Skimming
The first documented examples of using foam generation to remove organic compounds from water can be traced to Ostwald, and independently, Schutz in 1937 (Ostwald, 1937; Schutz, 1937). Thiel claims that water purification via skimming was introduced into the aquarium hobby in the 1960’s by Huckstedt (Thiel, 1997; Huckstedt, 1972), but the practice did not gain much traction until a resurgence of interest in keeping corals brought it to the fore again in the 1990’s. Another early notable advance in using foam flotation technology for saltwater purification was described by Wallace (Wallace, 1969). The early developments in water purification then led to advances in two disparate venues; wastewater remediation, and protein purification (Lemlich, 1972; Okamoto, 1979; Clark, 1983; Caballero, 1990). The application of skimming in aquarium husbandry was an outgrowth of successful implementation of foam fractionation techniques in these areas, and the development of modern skimmers owes much to these pioneering efforts. Foam fractionation in particular proved to be a valuable asset in enabling the isolation/recovery of desirable proteins from dilute solutions in many areas of food and pharmaceutical science. In this context, the goal was just the opposite of protein skimming in aquaria; recovery of valuable proteins in the foam with discharge of the depleted water phase. In contrast, of course, protein skimming in aquaria is used to remove undesirable organics from the (valuable) tank water. Nevertheless, the processes are identical, a conceptual convergence that becomes important in assessing the influence of various input parameters on skimmer performance. Specifically, the pivotal role of foam fractionation-based purification in protein recovery has prompted many research groups to conduct studies designed to optimize protein purification by tweaking input variables. It is possible that these studies can inform the aquarium skimming area as well. Much effort has been directed to measuring how changes in (a) gas flow rate, (b) liquid flow rate, and (c) bubble size influence two important figures-of-merit in the protein purification (and by inference, aquarium skimming) area; enrichment (E) and recovery (R). Enrichment (E) is defined slightly differently by different authors. Some authors describe E as the ratio of the protein concentration in the (collapsed and removed) foam head relative to the protein concentration in the skimmer feed solution (E = Crecov/Cin in Fig. 1) (Uraizee, 1996; Brown, 1990), whereas other authors define this quantity as the ratio of protein concentration in the foam head compared to the protein concentration in the output solution of the skimmer (E = Crecov/Cout in Fig. 1) (Ahmed, 1975; Schnepf, 1959). The numbers obtained by these two definitions do not differ greatly, and so this distinction is not critical. A second figure-of-merit often cited in these skimmer performance studies is recovery (R), which is defined as the amount of protein removed from the solution by the skimmer relative to the amount of protein fed into the skimmer. The recovery R can be expressed as a percent of protein removed after a specified time: i.e., 50% of the protein has been recovered after 90 minutes. These two measurable quantities typically run in opposite directions; that is, those changes that increase the enrichment typically decrease the recovery, and vice versa.
Both enrichment and recovery have counterparts in the aquarium skimming area. Dry skimming implies very little water hold-up in the foam, and this scenario is more closely aligned with enrichment. Thus, maximizing foam enrichment while dry skimming should maximize impurity removal from aquarium water. In contrast, wet skimming, with its proportionally larger liquid hold-up in the foam, falls more under the aegis of the “recovery” manifold of skimmer operation. That is, the removal of organic-rich foam and entrained aquarium water that contains organics (= wet skimming) should lead to a greater overall removal of the organic impurities in the aquarium water. In this case, maximizing recovery R should lead to maximizing water purification. To the extent that an aquarist aligns their skimming technique with one or the other extreme, then the lessons learned about optimizing either enrichment or recovery might prove insightful. Wet skimming bears the added burden of introducing possible salinity fluctuations, as the aquarium water removed in the foam phase must be replaced by water of equivalent salinity in order to maintain the overall tank’s salinity. To the extent that this match is not maintained, the tank’s overall salinity may vary. Thus, a compromise between wet and dry skimming often is sought.
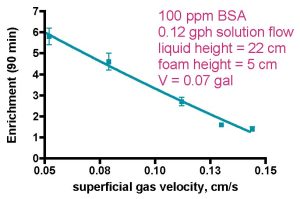
Figure 2a. Skimmer performance as a function of gas flow rate (from Brown, 1990).
In the final analysis, any operational parameter changes that increase the amount of organic material removed from the aquarium water is equivalent to achieving better water purification. Protein purification studies typically focus on enrichment E, as the purity of the recovered protein, which may find use in food and/or biomedical applications, often is paramount. Thus, biomedical and food science researchers are willing to sacrifice removal capacity (higher R) for product purity (higher E). Nevertheless, the reciprocal relationship between the two skimmer benchmarks suggests that lessons learned in the protein purification area can provide insight into aquarium skimming as well. Typical results from the protein purification area serve to illustrate the connection, Figs. 2, 3, and 4. In these studies, a model protein, Bovine Serum Albumin (BSA) in high ionic strength water (~ 5.8 ppt of NaCl; compare saltwater ~ 35 ppt of all salts) is circulated through a model skimmer with concomitant introduction of air through a bubble-making porous frit. The collected and collapsed foam is removed and assayed for protein concentration, as are the skimmer’s input and output streams. Fig. 2 illustrates how E and R run in opposition when gas flow rate is the experimental variable. Thus, higher gas flow rates decrease E but increase R, at least over the flow ranges tested.
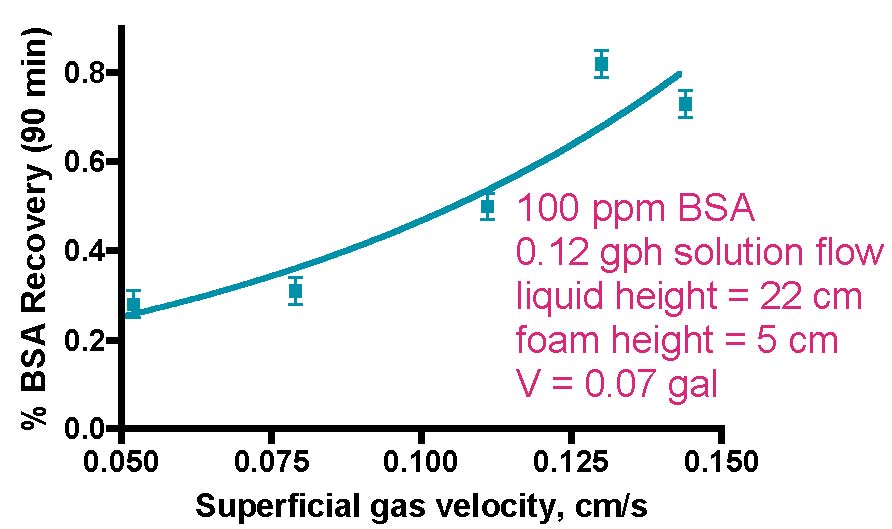
Figure 2b. Skimmer performance as a function of gas flow rate (from Brown, 1990).
A comprehensive and quantitative explanation for these trends (E or R vs. gas flow rate) is lacking, but a qualitative rationale for these observations has been developed (Brown, 1996; Uraizee, 1996; Du, 2000; Wong, 2001; Rosa, 2007). The key is the behavior of the bubbles, both as they transverse the solution absorbing BSA, and then in the foam, where they coalesce. There are several different properties of bubbles in these different environments that impact the overall E or R, and some of these properties run in opposition. Thus, the aggregate observed behavior (increasing or decreasing E and R) reflects the competition between these opposing phenomena. Specifically,
- The surface area of the bubbles is a key parameter, as that is where protein absorption occurs. Smaller bubbles have a greater surface area per unit volume. In solution, the bubbles are nearly spherical, and the surface area, A, = 6/d (d = diameter of the bubble). In the foam, the bubbles actually adopt a dodecahedral shape (= 12 sided) as a consequence of its six nearest neighbor interactions, and A = 6.6/d (Du, 2001). So, in the liquid phase, smaller bubbles will lead to greater bubble surface area for a given volume, which in turn enhances both enrichment and recovery.
- Liquid entrained in the foam drains back down from the foam phase into the bulk solution. For a variety of complicated reasons, larger bubbles result in faster foam drainage. In general, this drainage serves to increase enrichment, E, as it removes from the foam some liquid which is not as rich in protein as are the bubbles themselves. By default, the remaining foam then is more highly enriched in protein, leading to a larger measured E. For these reasons, larger bubbles in the foam phase increase enrichment.
But, what factors influence the bubble size?
The relationship between superficial gas flow rate and bubble size is complex and appears to depend on the details of the bubble generation process. In the Brown work cited above, faster gas velocities lead to marginally smaller bubbles for the 4-10 µM frit size employed (Brown, 1990). Using frits with larger pore sizes for bubble formation than the one Brown et al. employed in generating the data of Fig. 2, Rosa and, independently, Wong, and Tanner report that the bubble size slightly increases with increasing superficial gas velocity (Wong, 2001; Du, 2002; Rosa, 2007). Enhanced bubble coalescence due to more bubble-bubble collisions at the faster gas flow rates is cited as the rationale (Wong, 2001). In no case are the changes in bubble size very large as the gas flow rate varies over the range examined.
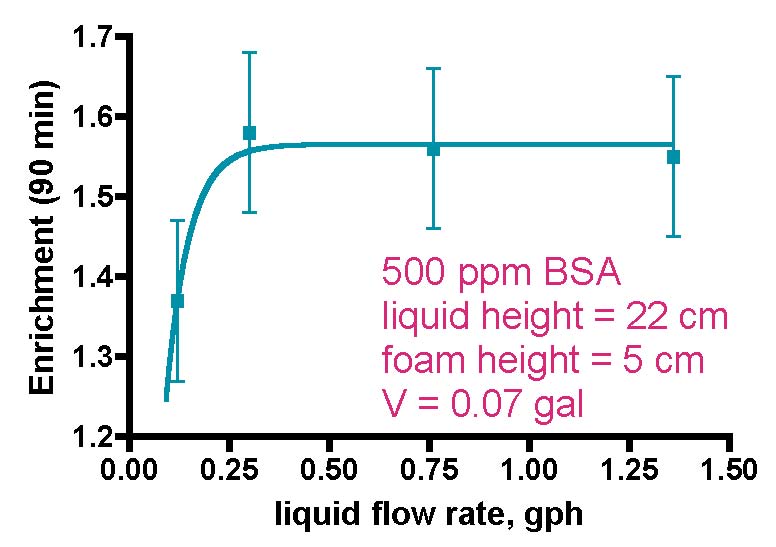
Figure 3a. Skimmer performance as a function of water flow rate (from Brown, 1990).
As far as enrichment vs. gas flow rate goes, drainage from larger bubbles in the foam (point 2 above) appears to predominate over the greater protein binding surface area of the smaller bubbles in the liquid (point 1 above) under Brown’s experimental conditions, and so the enrichment data in Fig. 2 result. In actuality, slower gas velocities result in complementary effects that both influence E in the same direction; (a) the aforementioned greater foam drainage as a consequence of the larger bubbles, which increases E (Gehle, 1984), and (b) greater protein absorption due to greater bubble residence time in the liquid phase (Bhattacharjee, 1997), which should increase E also (Uraizee, 1996), thus providing a physical explanation for the E vs. gas flow trend shown in Fig. 2. Of course, at the other extreme, faster gas velocities entrain more liquid into the foam. This dilution with relatively protein-poor water diminishes the relative contribution of the protein absorbed on the bubble surface to the overall protein present in the foam, thus contributing to a decrease in enrichment at these faster gas flow rates.
Recovery vs. gas velocity is a different story; in this instance, the lesser amount of foam drainage resulting from the smaller bubbles that are generated at faster gas velocities actually should increase R, the recovery. That is, since the amount of protein residing in the foam is the sum of the (concentrated) protein on the bubble surface layer and the protein dissolved in the interstitial hold-up liquid, then anything that decreases foam drainage will increase the overall amount of protein present and hence recovered from the collapsed foam, and R will increase (Fig. 2, second graph). Enhancing this effect is the fact that more liquid is entrained into the foam at higher gas velocities (Uraizee, 1996; Wong, 2001). The complementary conclusion holds as well; larger bubbles from slower gas velocities lead to more foam drainage and a decrease in recovery.
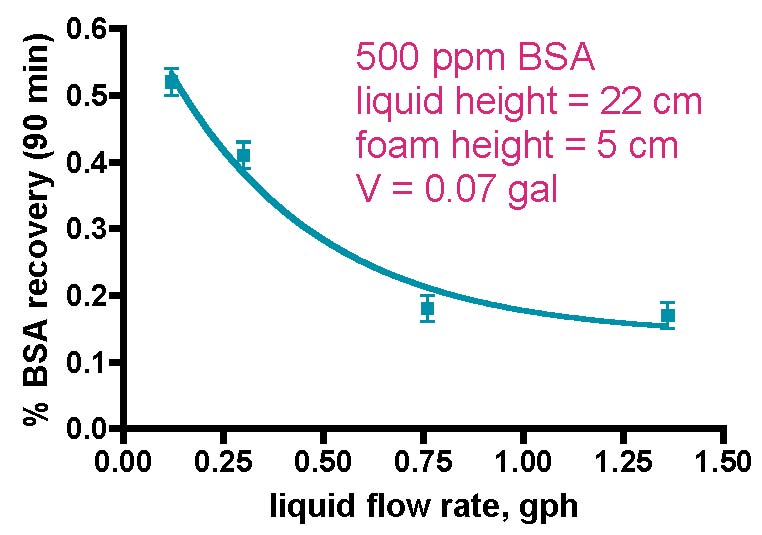
Figure 3b. Skimmer performance as a function of water flow rate (from Brown, 1990).
In a separate series of experiments, Brown also has shown that increasing the flow rate of the liquid through the model skimmer leads to a measurable decrease in recovery, but not much change, except at very low flow rates, in the enrichment, Fig. 3. Of course, the liquid flow rates examined in these experiments are orders-of-magnitude less that the flow rates used in aquarium skimmers, but that disconnect is balanced out somewhat by the fact that the model skimmer used in these studies is just a bit larger than a toilet paper tube. An explanation for these trends is provided below.
Protein recovery as a function of liquid flow rate is determined once again by the intersection of two opposing effects. Faster liquid flow rates lead to smaller bubbles both in the liquid phase and in the foam phase (Brown, 1990; Wong, 2001; Du, 2002). The former observation is attributed to less opportunity for bubble-enlarging coalescence, whereas the latter result is explained by citing diminished coalescence of bubbles in the foam as a consequence of protein concentration/bubble surface tension effects (Wong, 2001). If this bubble size effect was dominant, we might expect that recovery would increase as liquid flow increased (= smaller bubbles), since foam drainage would be diminished. However, that expectation is not met experimentally. Therefore, another phenomenon must be in play, and Wong theorizes that faster liquid flow leads to less contact time between the rising bubbles and the protein-containing liquid phase. In this scenario, less protein will be captured on the bubble surface, and overall recovery suffers (Wong, 2001).
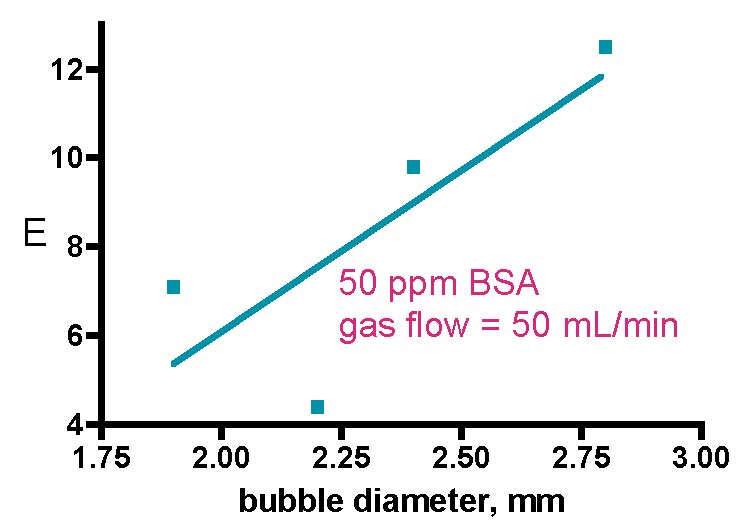
Figure 4. Skimmer performance as a function of bubble size (Aksay, 2007). These experiments were run in batch mode.
Bubble size occupies a central role in aquarium skimmer performance discussions, and not surprisingly, this topic clearly retains its importance in the protein purification literature as well. Unfortunately, hard data on the direct effect of bubble size on either enrichment or recovery are scarce, and Aksay’s report of enrichment and recovery as a function of bubble size represents perhaps the best information to date (Aksay, 2007; see also Uraizee, 1996). In this report, Aksay and Mazza document that the enrichment increases and the recovery decreases as bubble size increases, Fig. 4. Explanations for these trends have been discussed previously; larger bubbles lead to more foam drainage, which increases enrichment. On the other hand, these larger bubbles (a) trap less protein per-unit-volume and of course (b) enhance foam drainage, leading to a decrease in recovery. As an aside, the whole topic of measuring bubble sizes during a skimmer run is fraught with controversy; most authors use photography to characterize bubbles at the skimmer wall only (Brown, 1990; Uraizee, 1996; Wong, 2001; Aksay, 2007), but that approach has been criticized by Tanner, who has developed an indirect technique to measure bubble sizes at any position in the foam (Du, 2001; Du, 2003). He found that wall effects do indeed exist, and foam interior bubbles appear to be ~ 1.5 times larger than the wall bubbles.
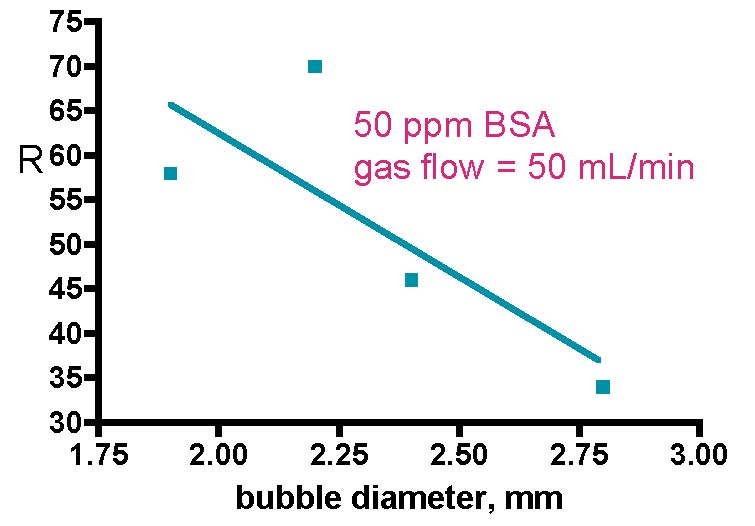
Figure 4b. Skimmer performance as a function of bubble size (Aksay, 2007). These experiments were run in batch mode.
The relationship of the Figs. 2-4 model system data to authentic skimmer performance in an aquarium setting remains to be established, of course, but these experimental results do serve as an alert that skimmer performance studies are possible when the criteria for success can be defined and measured. For example, one of the implications of these studies is that there may be an “optimum” bubble size for maximizing enrichment, as discussed by Uraizee (Uraizee, 1995). This provocative suggestion adds a new dimension to typical skimmer operational descriptions in the aquarium literature that emphasize only maximizing bubble surface area (i.e., more smaller bubbles per unit volume) in order to maximize organic removal. An aquarist using the information on enrichment and recovery discussed above might be inclined to conclude that the best skimmer performance can be achieved by operating with a lower liquid flow rate and a higher gas velocity. We will see later that when other criteria perhaps more relevant to aquarium skimming are included in the discussion, this conclusion does not necessarily hold.
In addition to the three operating variables described above (liquid flow rate, gas flow rate, and bubble size), several other aspects of protein skimmer performance have been examined. For example, the effect of (1) pH of the liquid phase, (2) feed flow concentration of BSA, and (3) liquid pool height all have been benchmarked vs. enrichment and recovery. Furthermore, much effort has been directed to developing mathematical models with predictive value for E and R as a function of various input variables. Unfortunately, that modeling has not lent any greater insight into protein skimming than could be derived by examining the data directly. The interested reader is referred to the articles cited above for details on all of these points.
The Goals of Our Research
The research described above on protein enrichment and recovery with model skimmers does not directly address the needs of aquarists, although it does provide some insight into the relationship between operational parameters and some aspects of skimmer performance. We sought to develop more useful metrics for measuring skimmer performance in an authentic aquarium setting. Further, we sought to apply those metrics to comparing directly the performance of (a) four different but representative skimmers, and (b) a given skimmer under different operating conditions, to illustrate how this methodology might be employed.
Defining Useful Skimmer Performance Metrics
Two measures of skimmer performance that we postulate will be of interests to aquarists are (1) the rate (speed) by which the skimmer removes organic contaminants, and (2) the amount of organic contaminants removed relative to the total amount present in the tank water. From here on, we will refer to the organic contaminants as Total Organic Carbon (TOC). For a review of TOC values and related issues in marine aquaria, see our earlier articles (Feldman, 2008c; Feldman, 2008d). The first of these metrics, the rate of TOC removal, is a kinetic quantity; the second (how much TOC is removed) is a thermodynamic quantity. They both report on different properties of skimming, and there is no conceptual reason why they must run in parallel. That is, high rates of TOC removal do not necessarily correlate with large amounts of TOC removal, and vice versa. These criteria for skimmer performance are no different that the criteria we invoked in our earlier GAC (granular activated carbon) studies, and the interested reader can obtain further background information from those articles (Feldman, 2008a; Feldman, 2008b).
The Rate of TOC Removal – Mathematical Formulae
It is essential to devise a robust mathematical model in order to extract useful quantitative information about the rate of organic impurity removal by a skimmer. The recirculating reservoir/skimmer system maps quite closely onto a fundamental textbook problem in mass transfer/fluid flow encountered in introductory chemical engineering courses called the “well-stirred reactor” problem. In this instance, both the skimmer and also the reservoir can be modeled as “well-stirred reactors” with a given flow Q between them. A component of the water is depleted in the skimmer by bubble-mediated removal. Since both “reactors” are interconnected, the level of the component will drop in the reservoir as well, and our task will be to develop a mathematical model that relates the removal in the skimmer with the measured depletion in the reservoir. In our experimental setup, a liquid volume Vr (saltwater in a Rubbermaid tub) has an input stream and an output stream, and some organic impurities in the liquid become depleted over time via bubble-mediated removal in a skimmer with water volume Vs. In actuality, Vs is just that volume in the skimmer reaction chamber where bubble-mediated organic extraction occurs. Inspection of the skimmers in action (see Fig. 7) permits estimation of this “active” skimmer volume, which is the value that we will use for Vs. For the purposes of this analysis, we will assume that all of the active volume is water; that is, we will ignore the void volume of the bubbles, as we cannot independently assess the relative contributions of bubbles and water. This assumption will introduce an error into the calculations, but that error should be systematic for all skimmers, and since we are interested in relative and not absolute skimmer performance, this error should not affect the conclusions. Knowledge of the precise mechanism by which the skimmer’s bubbles removes the water component(s) is not required; all
that we need to know is that the concentration of the measured water component (the organic impurity in this case) is diminishing with time in the reservoir. We have examined skimmer performance with both Bovine Serum Albumin (BSA) in freshly prepared saltwater as a model for TOC in aquarium water, and authentic TOC in reef tank water. The mathematical derivation uses TOC for convenience, but the formulae are identical with BSA as well (i.e., substitute BSA for TOC in the equations below).
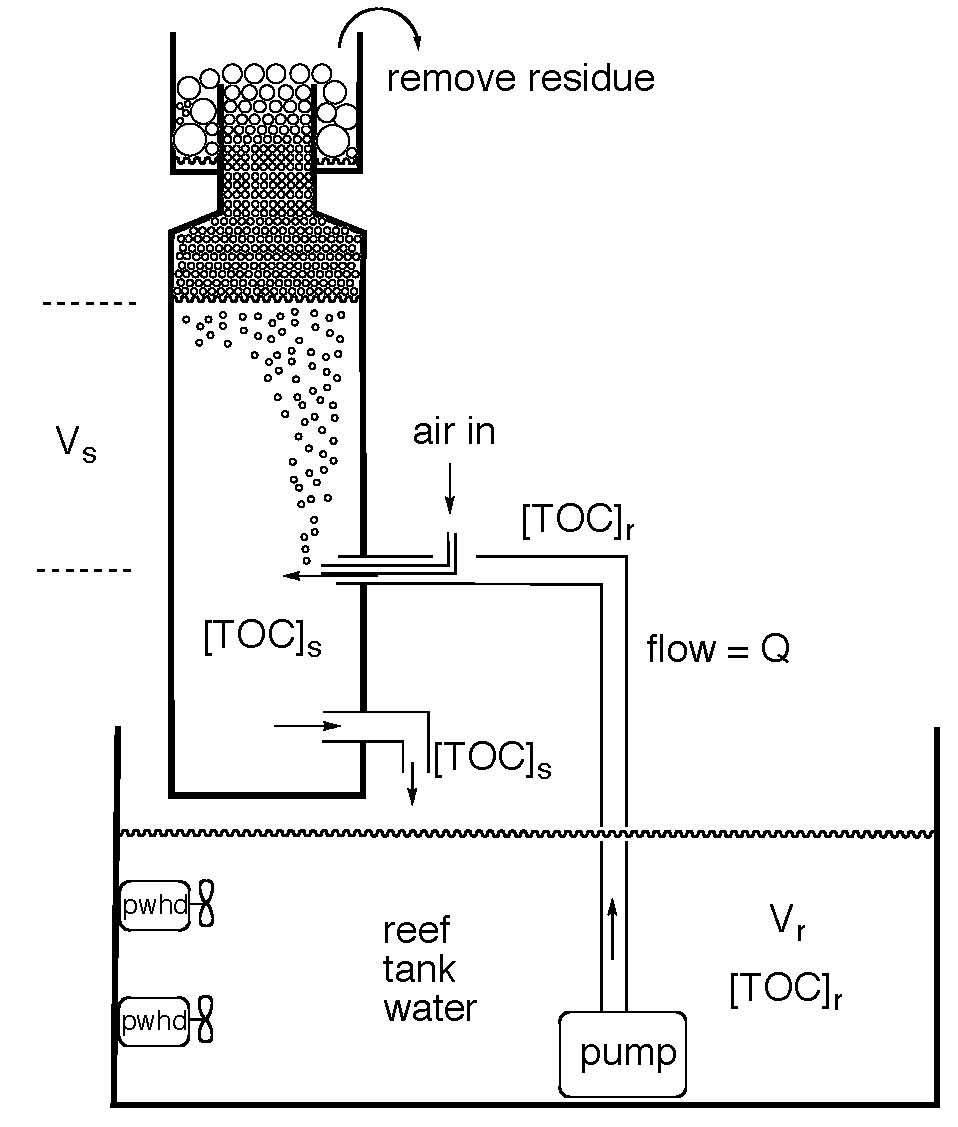
Figure 5. The skimmer/reservoir system used for derivation of the math that leads to k, the rate constant for TOC removal.
It is essential for solving this problem that both the reservoir and the skimmer water volumes are well mixed to avoid concentration gradients (Felder, 2005). The reservoir water mixing in the experiments described below is provided by the skimmer return flow and by two powerheads in the reservoir. We independently tested the “well mixed” assumption in the reservoir by sampling TOC levels at a given time point at different locations (i.e., top, bottom, left side, right side) during a skimmer run. We observed that the site-to-site variation in TOC levels at different locations was no greater than the sample-to-sample variation at one location (both ~ 10%), suggesting that there is no reason to suspect that the “well mixed” assumption is not applicable. The mixing in the skimmer reaction chamber is provided by both rapid water movement and the agitation caused by the motion of the bubble stream. We have no independent experimental measurement/confirmation of mixing behavior in the skimmer. A related but simpler mathematical approach recently has been applied to skimmer performance analysis in a different context by Rosa (Rosa, 2007, cf. Eq. 4).
The fundamental physical property of the system that we will rely on to develop a mathematical model for skimmer performance is called mass balance; conservation of mass dictates that mass (matter, in this case TOC) cannot be created or destroyed, and so the amount of TOC depleted from the reservoir must be equal to the amount of TOC that is removed by the skimmer’s bubbles. The fundamental mass balance equation is given in Eq. (1). Details can be found in the Wikipedia entry for “Mass Balance” and “Continuously Stirred-Tank Reactor”.
(1) input + generation = output + accumulation
For the problem in hand, there is no generation of TOC; rather, TOC is removed by the skimmer’s bubbles, so we will replace the “generation” term with “removal” (actually, just the negative of generation). In addition, since there is no TOC generation, there will be no TOC accumulation; rather, TOC is depleted in the system over time, so we will replace the “accumulation” term with “depletion” (just the negative of accumulation). So, the new mass balance expression applicable to both the reservoir, and independently, the skimmer is
(2) input + removal = output + depletion
We will focus on the reservoir first. There is no explicit TOC removal in the reservoir, so “removal” in Eq. (2) = 0. The input is equivalent to the mass of TOC added over time, say milligrams-per-minute (mg/min). In fact, since one term of Eq. (2) has units of mg/min (or more generally, mass/time), then all of the terms in this equation must be expressed in these units. The mass (amount) of TOC added in the input stream is the concentration of TOC, [TOC]s (in mg/gal) times the volumetric flow rate of the input stream, Q (Q in gal/min). That is,
(3) mass of TOC added over time in input stream = Q•[TOC]s
Note how the units of these terms are consistent: Q (in gal/min) • [TOC]s (in mg/gal) = mg/min units, which is just what the “mass of TOC added over time” requires. The output stream of the reservoir can be treated in a similar manner:
(4) mass of TOC removed over time in output stream = Q•[TOC]r
So, referring back to Eq. (2), with removal = 0, we have
(5) Q•[TOC]s = Q•[TOC]r + depletion
What mathematical expression can we use for “depletion”? The amount of TOC in the reservoir volume Vr is simply the product of the TOC concentration, [TOC]r, and the volume:
(6) amount of TOC in the reservoir = Vr•[TOC]r
We can simply define “depletion” to mean the rate of change (decrease) in the TOC amount in the reservoir over time. Note that once again, the units of this term are in mass/time (“mg/min”).
(7) depletion = Vr•d[TOC]r/dt
Now, returning to Eq. (5), we can insert the depletion term and generate the full mass balance expression for the reservoir:
(8) Vr•d[TOC]r/dt = Q•([TOC]s – [TOC]r), where
Vr = the total volume of the reservoir water, in gal
[TOC]r = the concentration of TOC in the reservoir at any time t and also the concentration of TOC in the stream leaving the reservoir and entering the skimmer
Q = the flow through the system, in gpm
[TOC]s = the concentration of TOC in the stream leaving the skimmer and entering the reservoir
Eq. (8) says that the change in the amount of TOC in the reservoir (the left hand side) is equal to the difference between the reservoir input and output TOC concentrations ([TOC]s – [TOC]r) times the flow rate (the right hand side). Note that this expression includes information about TOC concentrations in both the reservoir and the skimmer.
A similar expression can be developed for the fate of the TOC concentration just in the skimmer. However, in this case, “removal” does not equal 0, as the bubbles in the skimmer actively remove the organic impurity. So, from Eq. (2),
(9) Vs•d[TOC]s/dt = Q•([TOC]r – [TOC]s) + removal
We must include another term (removal) in Eq. (9) that explicitly accounts for this TOC removal in order to maintain the required mass balance. This TOC removal term must take into account the function of the bubbles. The fundamental chemical equation for TOC removal by the bubbles is:
(10) TOC + bubbles → TOC•bubbles
This simple equation undergirds the assumption that allows the mathematical analysis to proceed: the key assumption is that the rate of TOC removed by the skimmer’s bubbles is proportional to the amount of TOC present in solution. This assumption permits us to connect the [TOC] changes that happen in the skimmer with the [TOC] changes that happen in the reservoir. Since the bubbles are continually being introduced in large excess compared to the TOC concentration in solution, the “concentration” of the bubbles remains for all intents and purposes constant, and so we do not have to worry about how changes in bubble concentration might influence the rate of TOC removal. This model (and its underlying assumptions) greatly simplifies the mathematical analysis. In terms of the discipline of chemical kinetics, this approach is called the “pseudo-first order” approximation. So, the amount of TOC in the active skimmer reaction chamber volume Vs is given by the
concentration times the volume:
(11) amount of TOC in the active water volume of the skimmer = Vs•[TOC]s
By the assumption discussed above, the rate of TOC removal by the bubbles is proportional to the amount of TOC present:
(12) rate of TOC removal by the bubbles ∝ -Vs•[TOC]s
Note that we must include a “-” sign in front of Vs•[TOC]s because the amount is decreasing with time. We can introduce a proportionality constant, k, to convert Eq. (12) into an equality.
(13) rate of TOC removal by the bubbles = -k•Vs•[TOC]s
The term k•Vs•[TOC]s must have units of mass/time (i.e., mg/min) in order to “fit” into Eq. (9). Since Vs•[TOC]s has units of mass (mg), then k must have units of /time (i.e., per min). As such, k is often referred to as a rate constant; it expresses how something changes over time (“per min”). This proportionality constant is not just a mathematical convenience. It will report on a fundamentally important property of a skimmer. The constant k can be viewed as a measure of how efficiently the bubbles remove TOC. The efficiency of TOC removal is a complex function of many factors (bubble size/density, bubble residence time, solution diffusion, mass transfer to the bubble, foam coalescence, binding to the bubble surface, etc.). In fact, it is just this value k that we are after; k is actually a singular measure of skimmer efficiency in removing TOC. The larger that k is, the faster that the skimmer will remove TOC. Thus, k is an intrinsic measure for TOC removal, and it reflects, in the aggregate, all of the parameters that contribute to the efficiency of TOC removal for a given skimmer. However, k does not offer any insight into which parameters, in particular, are more or less important in determining skimmer performance. We can measure experimentally k for different skimmers, and compare these values. Skimmers with larger k values will be more efficient (i.e., faster) at removing TOC from aquarium water. So, by including the information in Eq. (13) in Eq. (9), we have
(14) Vs•d[TOC]s/dt = Q•([TOC]r – [TOC]s) - Vs•k•[TOC]s
This rather complex equation is important because, for the first time, we have mathematically linked the experimentally measurable quantity, the concentration of TOC in the reservoir, [TOC]r, with quantities specific to the skimmer (Vs, [TOC]s). However, Eq. (14) as written is difficult to manipulate, so we will define a new mathematical quantity that will help us simply the math and arrive at a very useful expression. We define a dimensionless time τ = Q•t/Vr. Applying this definition to Eq. (14), we can generate the following expression:
(15) (Vs/Vr)•d[TOC]s/dτ = [TOC]r – [TOC]s – Vs•k•[TOC]s/Q
The purpose for this seemingly arbitrary definition/substitution exercise now can be revealed. The use of τ allows us to isolate the dimensionless quantity Vs/Vr, which is the ratio of the active skimmer volume to the reservoir volume. We can inject a dose of physical reality into the mathematics at this point. The reservoir volume (30 or 35 gallons) is much larger than the skimmers’ volumes (0.62 – 1.26 gallons, see below) and so the ratio Vs/Vr hovers in the 0.02 – 0.04 range. If the second term in the left-hand part of Eq. (15), d[TOC]s/dτ is not too large, then the Vs/Vr term will dominate, and we can neglect the entire left-hand term of Eq. (15); that is, we can, to a first approximation, set (Vs/Vr)•d[TOC]s/dτ = 0. In the Results section, we will provide experimental justification for the claim that d[TOC]s/dτ, is not large. By applying this approximation, we can relate the TOC concentration in the skimmer, [TOC]s, to the TOC concentration in the reservoir, [TOC]r:
(16) 0 = [TOC]t – [TOC]s – k•[TOC]s•Vs/Q, or
(17) [TOC]s = [TOC]r/(1 + k•Vs/Q)
We now can plug this [TOC]s value back into Eq. (8) and divide both sides by Vr:
(18) d[TOC]r/dt = (Q/Vr)•([TOC]r/(1 + k•Vs/Q) – [TOC]r)
Rearranging the various terms yields a differential equation:
(19) d[TOC]r/[TOC]r = -[k•Q/(Vr•(k + Q/Vs))]•dt,
and solving the differential equation yields
(20) Ln([TOC]r/[TOC]0) = -[k•Q/(Vr•(k + Q/Vs))]•t
Eq. (20) provides the means to extract the desired quantity, the rate constant k, from the experimental data. Eq. (20) predicts that the graph of -Ln([TOC]r/[TOC]0) vs. time t will be linear, with a slope of k•Q/(Vr•(k + Q/Vs)). By plotting -Ln([TOC]r/[TOC]0) vs. t, the desired value k can be calculated for any input flow rate Q, reservoir solution volume Vr and active skimmer volume Vs. Note that [TOC]0 = the concentration of TOC at t = 0, the beginning of the experiment. Remember that the rate constant k for TOC removal has the units min-1; that is, k is expressed as “per minute”.
Equation (18) expresses a subtle but important aspect of this modeling; the difference between a rate and a rate constant. Our interest in comparing different skimmers focuses our attention on the rate constant k. As discussed above, this single value is an aggregate measure of the efficiency of a given skimmer in removing TOC; it reflects all of the intimate structural and molecular details that impact on organics removal (see above). However, the overall rate of TOC removal (different than the rate constant!) is expressed by Eq. (18). That is, the rate is defined as the depletion of TOC over time, or d[TOC]/dt (the left hand part of Eq. (18)). Eq. (18) indicates that the rate of TOC removal is a complex function of k, the flow rate Q, and the system volumes Vs and Vr. If fact, the quantity Vr/Q (the inverse of Q/Vr in front of the right-hand term) is really just the turnover of the system; Vr/Q = the time that it takes for one reservoir volume to pass through the skimmer. Thus, increasing k, or increasing Q, or decreasing Vr will all increase the overall rate of TOC removal. There is nothing in the mathematical derivation to indicate whether k itself is a function of Q or not. That point will have to be tested through experiment, as described below.
The Amount of TOC Removed
Obtaining a reliable measure of the amount of organic impurity removed from the aquarium water requires a little more analysis and a bit more math. The mathematical expressions in Eqs. (19) and (20) above speak to a particular type of TOC depletion process called “exponential decay”. That process is characteristic of a scenario where the rate of TOC depletion is proportional to the amount of TOC present (remember our assumption). It is possible to use a computational technique called curve fitting to derive a new mathematical expression, different than (but related to) those discussed above, to tease out one critical number; the level of TOC remaining when the skimmer just does not remove any more material no matter how long the experiment is run. The expression is illustrated in Eq. (21). The key number is called the “plateau”, and simply subtracting the plateau value from the starting [TOC] value, [TOC]o, will give the desired quantity; the amount of TOC removed (see Fig. 6). In principle, we can report this quantity as a concentration (i.e., ppm of TOC removed), or as an absolute amount by multiplying the concentration by the system volume; in practice, we will simply describe it as the % of TOC depletion during the skimmer run. The implication of this analysis is that the skimmer will not remove all of the TOC. Referring back to Fig. 1, the molecules that do not have pronounced hydrophobic sections are not good candidates for removal by skimming, and so they should remain at this plateau level after all of the “skimmable” molecules have been removed. In reality (see Experimental Results below), this model provides a reasonable approximation of the data; it gives us a means to estimate how much TOC is remaining when the skimmer has exhausted the supply of removable TOC.
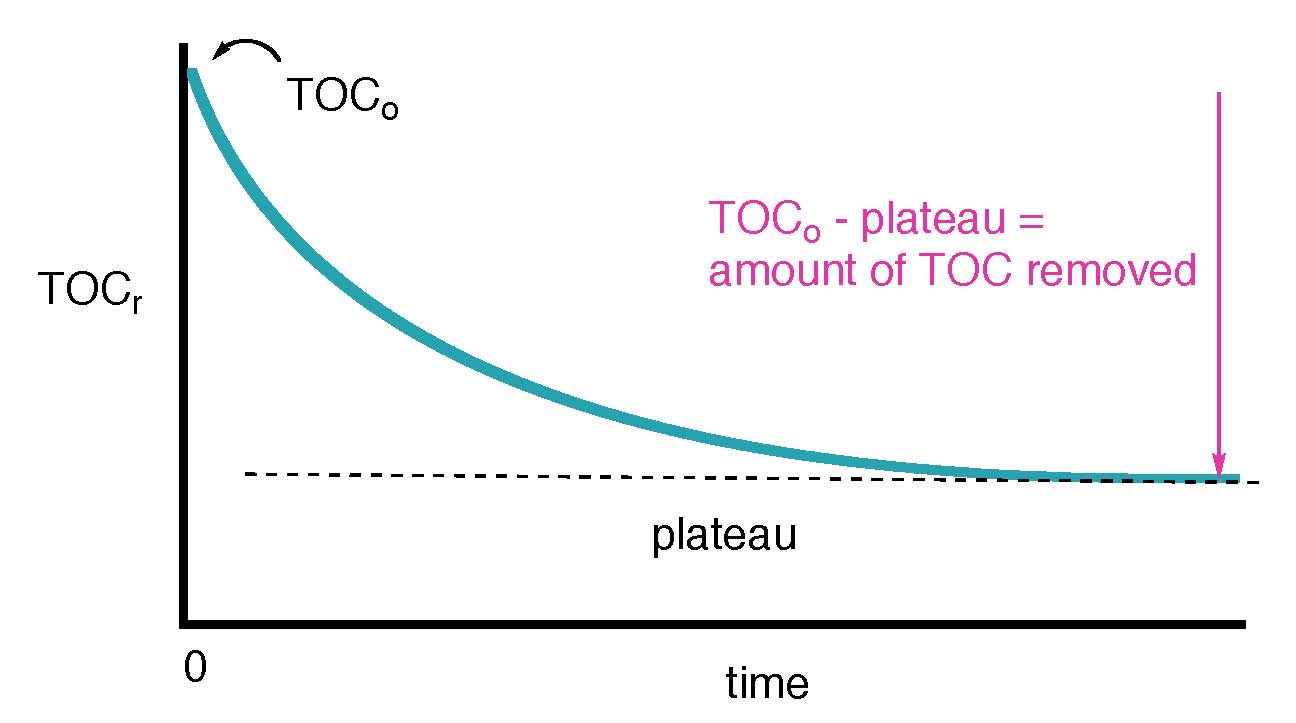
Figure 6. An illustration of how the amount of TOC removed can be determined from a hypothetical TOC exponential decay curve.
(21) [TOC]r = ([TOC]0 – plateau)e-Jt + plateau,
J = a constant which makes the curve fit the data; it has no direct physical meaning
Experimental Design
The experimental setup illustrated in Fig. 5 was used. A 40-gallon Rubbermaid tub served as the reservoir, and the various skimmers (see Fig. 7 below) were positioned above the reservoir so that the exit water returned to the reservoir about 3-5 inches above the water surface. The skimmers were fed by pumps that were on the manufacturers’ recommendation list. The pumps resided at the bottom of the reservoir and were attached to the skimmers via a ball valve and appropriately sized tygon tubing. The reservoir was equipped with a heater set at 77 °F and two powerheads to aid in circulation. In practice, the pump and powerheads generated enough heat so that the heater rarely turned on; the reservoir temperature fluctuated between 75 and 79 °F during the course of the runs. Prior to running a skimmer test, the reservoir was filled with distilled water, and this pure water was run through the skimmer, pump, powerheads, etc for 24 hours and then emptied. This cleaning procedure was
repeated at least five times before an actual skimmer run was attempted. Control measurements of TOC for this wash water revealed that by five washings, the TOC level in the reservoir was indistinguishable from that of pure distilled water. Thus, at that point, the equipment was no longer leaching organics into the water. Bovine Serum Albumin (1.33 gm, 96% pure from Sigma Chemical Company) was dissolved in 35 gallons of 35 ppt freshly prepared saltwater (Coralife brand salt mix) for the model system runs. For the skimmer runs with authentic TOC measurement, 30 gallons of aquarium water was removed at 60 ± 15 min after tank feeding (tank skimmer off) and transferred to the reservoir. The basis for the choice of this particular time point is discussed below. In all experiments, the skimmer pump was turned on (t = 0 min), and three independent 25 – 35 mL water samples were removed from the reservoir at fixed 10-min time points typically for 70 – 120 min. These samples were removed from a well-mixed portion of the reservoir distant from the skimmer effluent entry point. They were collected in specially prepared TOC analysis vials held by tongs to avoid contamination (see Feldman, 2008c for details) and immediately placed in a -23 °C freezer pending analysis. Control experiments determined that there was no difference in results between fresh and frozen samples. The BSA-containing samples from the model system runs were analyzed using a Pierce Micro BCA Protein assay kit following the manufacturer’s instructions with the addition of a brief sample centrifugation step prior to UV/VIS analysis. The assay was calibrated with BSA in saltwater. All of the authentic reef tank water samples were analyzed on a Shimadzu 5000 TOC Analyzer in one batch per experiment. The Analyzer was calibrated with potassium hydrogen phthalate as per instrument instructions. See our earlier work (Feldman, 2008c; Feldman, 2008d) for details of the TOC analysis. Data workup followed from the mathematical formulae described above.
The skimmers examined are shown in Fig. 7. These skimmers were chosen to have about the same manufacturers’ rating for tank size. The active volume of the reaction chamber for each skimmer is given in Fig. 7. In each case, the manufacturer’s recommendations were followed with respect to liquid height in the skimmer column and choice of feed pump. The Euroreef CS80 came with its own Sedra pump, whereas the remaining three skimmers were run from a Mag 9 pump. The water flow rates through the Precision Marine and ETSS skimmers were controlled by adjusting a ball value at the Mag 9 output and a gate valve at the skimmer output, as indicated in the manufacturers’ instructions, in order to keep the liquid level at the suggested height. The water flow rate through the Euroreef CS80 skimmer was adjusted by varying the height of the exit tube, again to keep the water level at the suggested height. In all cases, the water flow rate was explicitly measured by timing the filling of a calibrated receptacle.
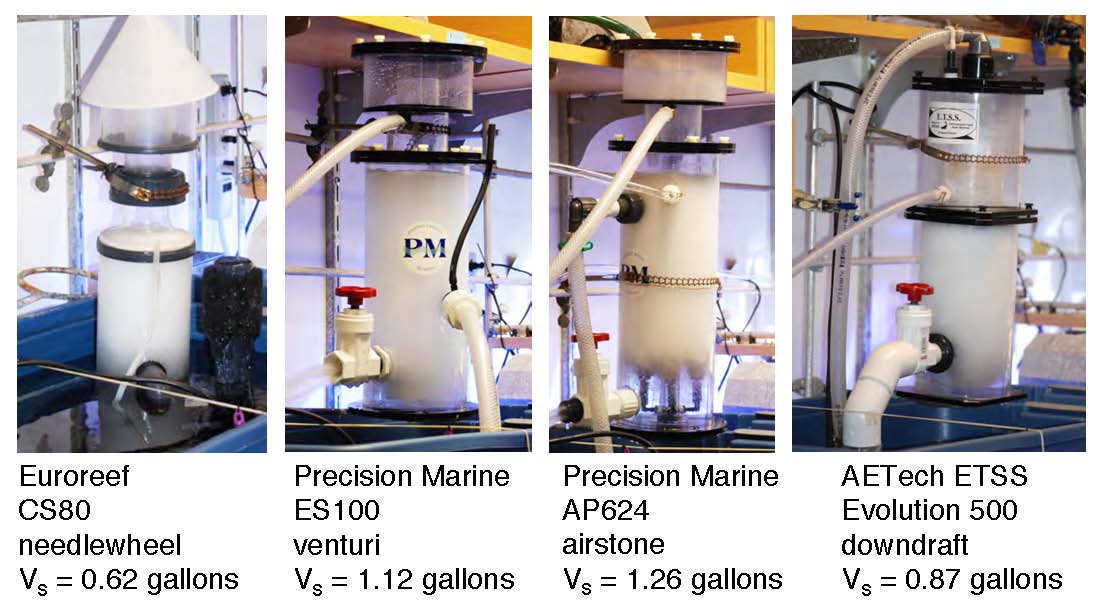
Figure 7. The skimmers examined in this study.
These skimmers were chosen based on their similar tank size ratings, but they are not identically sized (see the volume values in Fig. 7). Thus, these four skimmers differ in two potentially significant variables; the physical dimensions of the active reaction chamber and the method of bubble production. As discussed earlier, the mathematical analysis of this system explicitly includes the difference in physical dimensions of the different skimmer’s reaction chambers by incorporation of the active skimmer volume, Vs, in the formulae. In addition, adhering to the manufacturers’ pump/foam height recommendations will lead to different volumetric flow rates for the different skimmers. We will have to take this variation into account as we analyze the data, and it will constrain the conclusions that we can make regarding skimmer performance. Finally, we will not be able to extrapolate any conclusion we draw from these specific skimmers, for example, to all needlewheel skimmers vs. all downdraft skimmers or even to all needlewheel skimmers from the same manufacturer.
Experimental Results
Our solution to the overarching goal of developing a useful and exportable skimmer performance evaluation methodology owes much to the contributions of the researchers discussed in the History of Protein Skimming section. All of those studies used the test protein Bovine Serum Albumin (BSA) as an experimental tool. BSA offers some unique advantages as a model protein in skimmer studies, not the least of which is the fact that it is virtually the only commercially available protein that can be acquired in quite pure form (~ 96% pure) for little cost; about 5$ per skimmer run. BSA is soluble in saltwater, stable under skimming conditions, and easily measured down to the ~ 1 ppm level using the commercially available Pierce micro-protein assay kit. Use of this kit requires access to a UV/VIS spectrophotometer ($5 – 10K new, $500 used!), a constant temperature (60 °C) water bath, and a Microcentrifuge (~ $350 new). This procedure removes the need for really hi-tech instrumentation like the Shimadzu TOC Analyzer; with the above equipment, the simple assays can be conducted over the course of a few hours.
Thus, we initiated our studies of skimmer performance using BSA in freshly prepared saltwater. It will, of course, be necessary to demonstrate that this simple model system accurately reflects the operation of a skimmer with authentic aquarium water, and those studies will be described later in this report. We used the experimental set-up detailed in Fig. 5 and the accompanying text. The data workup utilized the mathematical formalisms derived earlier; we sought the two metrics, k (rate constant for BSA removal) and % of BSA removed. Data from an exemplary skimmer run with BSA in saltwater are illustrated in Fig. 8, and the mathematical work-up using Eq. (20) to obtain k is shown in Fig. 9. There is little-to-no refractory fraction that resists skimming; in fact, most of the BSA is removed over the experimental time course. Furthermore, the depletion in BSA concentration fits the experimental decay model (Eq. (21)) quite nicely over the entire time course; r2 for this curve = 0.97! These observations are consistent with the premise that BSA is a well-behaved material for skimming studies in saltwater.

Figure 8. BSA depletion in freshly prepared saltwater using the Euroreef CS80 skimmer. The green line is the best fit using Eq. (21).
One of the assumptions that underpinned the mathematical derivation of Eq. (16) was that d[TOC]s/dτ was not large, so the product (Vs/Vr)•d[TOC]s/dτ was very small (since Vs/Vr was small) and could effectively be set to 0. This assumption is equivalent to claiming that the skimmer did not remove a large amount of the organic impurity (BSA or TOC) per passage of one skimmer water volume through the skimmer. The data exhibited in Fig. 8 support that view. At the flow rate of the experiment (174 gph), the active skimmer volume (~ 0.62 gallons) is exchanged every 0.2 min. From inspection of the curve in Fig. 8, it appears that less than 1% of the BSA is removed per each 0.2 min increment. Thus, the assumption that only small amounts of organic impurities (BSA or TOC) are removed in each pass is validated.
The mathematical manipulation of these data in order to extract the rate constant k provided further encouragement that BSA in saltwater is a useful model for measuring skimmer performance. The -Ln([BSA]t/[BSA]o) vs. t plot of Fig. 9 is linear throughout the entire data collection range (r2 = 0.97), which is completely consistent with one of the major assumptions of the mathematical model (e.g., the rate of BSA removal is proportional to the amount of BSA present). The rate constant k can be calculated from the slope of this line; k = 0.95 min-1. This number has no intrinsic meaning with respect to skimmer performance. Only upon comparison of this value to the k’s calculated for other skimmers or for other operational parameters can meaningful conclusions be drawn. As indicated earlier, comparatively larger k values are indicative of faster BSA removal. Of course, the volumetric flow rates for the various skimmers are different, and we will see later that the rate constant k has a complex relationship with the flow rate Q (see Table 2) that ultimately limits the breadth of the conclusions that we can draw from the data.
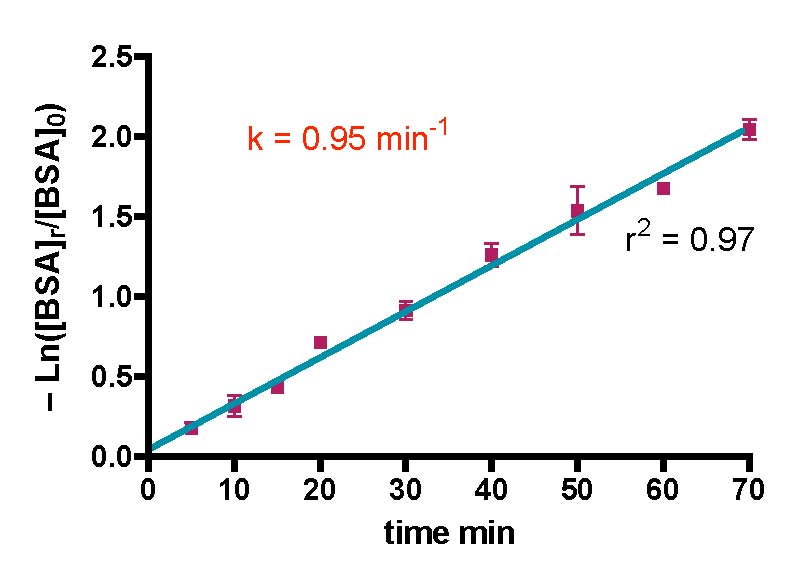
Figure 9. Mathematical treatment of the Euroreef CS80 data in Fig. 8 using Eq. (20) with Q = 2.9 gpm, Vs = 0.62 gallons, and Vr = 35 gallons.
The analysis of BSA removal rate constants (k’s) and % BSA removed can be extended to the other skimmers as well, Table 1. The water flow rates are given also. A comparison of the average k values for all four skimmers reveals no statistically significant difference amongst these skimmers’ rate constants for BSA removal from saltwater under the specified experimental conditions. Since the mathematical modeling already takes into account the differences in active reaction chamber volume between the skimmers, any remaining differences in rate constant k for BSA removal would have to be attributable to the other significant differences between these four skimmers; the method of bubble generation and the flow rate Q. The influence of Q is difficult to tease out (see below). Nevertheless, we can say that when running all four skimmers under the manufacturers’ recommended operating conditions, there was, in fact, no difference between the rate constants k. In this instance, the fundamental lesson learned from these studies can be summarized as “bubbles is bubbles”; the method of bubble generation (venturi vs. needlewheel vs. airstone vs. downdraft) does not have any demonstrable impact on the rate of BSA removal under these operating conditions.
| Trial | EuroReef CS80 needlewheel | ETSS Evolution 500 downdraft | ||||
|---|---|---|---|---|---|---|
| k min-1 | % BSA removed | Flow gph | k min-1 | % BSA removed | Flow gph | |
| 1 | 0.67 | 70 | 114 | 0.51 | 92 | 382 |
| 2 | 0.66 | 56 | 114 | 1.22 | 100 | 364 |
| 3 | 0.95 | 67 | 102 | 1.09 | 81 | 364 |
| 4 | 0.63 | 56 | 129 | 0.61 | 60 | 364 |
| 5 | 0.79 | 22 | 109 | 1.01 | 61 | 364 |
| 6 | 1.20 | 64 | 108 | |||
| 7 | 1.20 | 55 | 108 | |||
| Ave | 0.87±0.23 | 56±15 | 112±8 | 0.89±0.31 | 79±16 | 368±7 |
| Trial | Precision Marine ES100 venturi | Precision Marine AP624 airstone | ||||
|---|---|---|---|---|---|---|
| k min-1 | % BSA removed | Flow gph | k min-1 | % BSA removed | Flow gph | |
| 1 | 1.00 | 90 | 231 | 1.49 | 100 | 157 |
| 2 | 0.79 | 96 | 227 | 0.82 | 100 | 157 |
| 3 | 0.68 | 68 | 227 | 0.84 | 100 | 157 |
| 4 | 0.98 | 78 | 218 | 0.81 | 82 | 156 |
| 5 | 0.92 | 70 | 218 | 0.90 | 94 | 156 |
| 6 | 0.81 | 60 | 227 | |||
| 7 | 0.83 | 79 | 216 | |||
| Ave | 0.86±0.11 | 77±12 | 223±5 | 0.97±0.26 | 95±5 | 157±0.5 |
Table 1 details the % BSA removal values for the different skimmers in addition to the rate-of-removal (k) studies. For this figure-of-merit as well, there is not much variation amongst the 4 skimmers. The Precision Marine ES100, Precision Marine AP624, and the ETSS evolution 500 all remove BSA at the ~ 80% or greater level. The Euroreef CS80 stands out for its slightly lower BSA clearance. The large amount of scatter in these data (large error bars) tends to diminish the significance of any apparent difference amongst all four skimmers’ % BSA removal values. BSA contains both hydrophilic and hydrophobic portions, and so it is an excellent candidate for bubble binding and hence removal. This point, of course, was recognized by all of the previous workers who used BSA as a test case molecule in the protein purification studies discussed earlier.
The role of superficial gas velocity, and independently, liquid flow velocity, occupied the attention of many of the researchers studying protein purification by foam fractionation. These operational parameters can be varied in aquarium skimming as well, and so it seemed worthwhile to determine if the BSA-based experimental methodology could expose any correlation between gas or liquid flow rates and skimmer performance. Many of the more recently introduced needlewheel-based skimmers have an explicit means to vary input air velocity via an independent bubble-generating pump with a valve at the air input line. Unfortunately, neither the Euroreef CS80, nor the Precision Marine ES100 or ETSS evolution 500 skimmers offered any airflow regulation option, and so we did not have an opportunity to deliberately vary superficial air velocity as part of our studies with these skimmers. Fortunately, the airstone-based Precision Marine AP624 did have an air input system that was independent of the water flow system, and so it was possible to examine the question of air flow vs. performance, as indicated by the rate constant k, for this skimmer. Unfortunately, we did not have access to an air flow meter to directly measure this quantity. We could, however, adjust the pressure of the air source that feeds the airstones. This experimental approach is based upon the presumption that an increase in air pressure feeding the airstone translates into a higher superficial air velocity, but the precise relationship between these two quantities is unknown. In any event, the k value for BSA removal using the Precision Marine AP624 skimmer with a feed air pressure of 3 psi is k = 0.97 ± 0.26 min-1 (from Table 1). Increasing the air pressure to 6 psi led to k = 3.1 ± 0.2 min-1. Thus, doubling the air pressure approximately tripled the rate constant for BSA removal for the AP624 skimmer under the specified set of reaction conditions (~ 156/157 gph water flow in each case).
The final skimmer operational parameter tested was water flow rate. As discussed earlier, the mathematical derivation of the rate constant formula (Eq. 20) does not speak to the possibility that the water flow rate might influence the rate constant k, and so that relationship will have to be revealed through experiment. In general, simple adjustments in the ball valve at the pump exit and the gate valve at the skimmer exit port should suffice to keep the skimmer water level at the manufacturer’s suggested height. Nevertheless, we had some concerns about problematical experimental aspects for these trials, and these concerns constrained our choices of flow rate and skimmer. For example, we would have preferred to vary the flow rate by a significant amount, say 10x, in order to push the concept to its limits. However, the need to keep the water/foam boundary at the manufacturer’s recommended height limited the range that we could usefully examine. In addition, the Euroreef CS80 and the Precision Marine ES100 skimmers, which generate air flow (and hence bubbles) via the Venturi effect, might suffer from a materially diminished bubble stream at too low of a water velocity. In fact, preliminary scouting experiments with the Precision Marine ES100 venturi skimmer supported this view. The reaction chamber was filled with dense bubbles at 223 gph (Table 1 and Fig. 7), but dropping the flow rate to 180 gph led to a noticeable decrease in bubble density, and lowering the flow further to 144 gph almost abolished bubble generation. These observations underscore the difficulty with probing k vs. Q. In principle, we could adjust each skimmer’s flow to be equal to some predetermined “standard” value in an effort to remove this variable from the simmer runs. However, those adjustments would inevitably move at least one skimmer off of the manufacturer’s recommendations, and the bubble stream could suffer. Thus, equalizing the water flow rates is likely to skew rather than clarify the Q vs. k data. Therefore, we are faced with the prospect of trusting the manufacturers’ pump recommendations and their derived flows as being optimal, or at least adequate, for satisfactory bubble generation.
With these thoughts in mind, we examined the consequences of varying the water flow rate with the Precision Marine AP624 airstone skimmer, since this skimmer, uniquely, uncouples bubble generation from water flow. That is, the superficial gas velocity is set independently of water flow velocity, and so we could expand our range of flow rates without the concerns indicated above for Venturi-effect skimmers. The results are tabulated in Table 2. The k values do change as volumetric flow rate increases, but a trend is difficult to extract from these limited data. Initial doubling of flow Q led to an approximate doubling of k, but further increase of Q to 3.4x the initial flow resulted in a decrease in k to below the original value. The high r2 values for the mathematical analyses reflect the high quality of the data, but it is not possible to draw any compelling conclusions from this information. In addition, it is not prudent to extrapolate from these data to the behavior of the other three skimmers under varying flow rates. Overall, this uncertainty leaves us in a bit of a quandary with respect to assessing the impact of the differing flow rates on the k values obtained for the different skimmers in Table 1. In the final analysis, we have to trust the manufacturers’ pump recommendations as adequate for supplying sufficient water velocity to drive satisfactory bubble generation, and the strongest conclusion that we can draw regarding the k performance metric amongst the four skimmers is that under the manufacturers’ recommended operating conditions, all four skimmers exhibit indistinguishable rate constants for BSA removal.
| Trial | Flow Q gph | k min-1 | r2 |
|---|---|---|---|
| 1 | 156 | 2.5 | 0.98 |
| 2 | 156 | 3.2 | 0.99 |
| 3 | 156 | 3.6 | 0.97 |
| 4 | 318 | 7.7 | 0.98 |
| 5 | 318 | 7.9 | 0.96 |
| 6 | 318 | 7.3 | 0.97 |
| 7 | 540 | 2.5 | 0.98 |
The acquisition of internally consistent BSA k values for the different skimmers supports the premise that BSA can serve as an effective surrogate for TOC in reef tank water. Nevertheless, the relevance of these BSA studies to authentic aquarium water has not been established. In order to forge this link, we must demonstrate that the skimmers will also remove TOC from aquarium water with a similar trend.
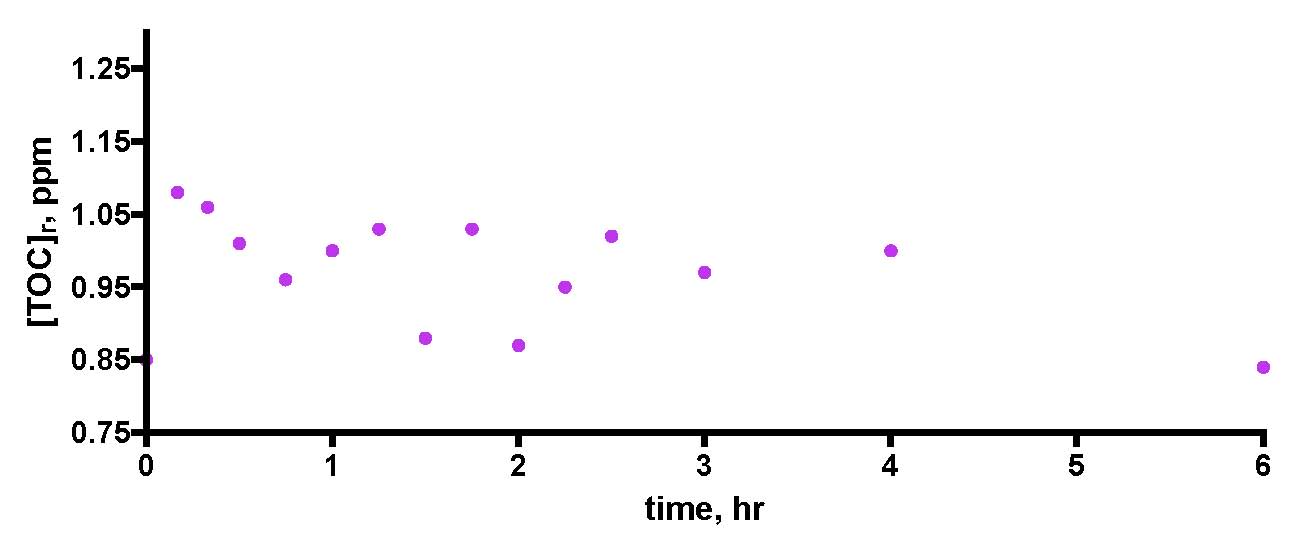
Figure 10. A first attempt to measure TOC depletion in authentic aquarium water using the Euroreef CS80 skimmer. The water sample was removed from the aquarium 24 hours after feeding.
As indicated in the Experimental section, the skimmer runs focusing on TOC removal from authentic reef aquarium water utilized tank water removed about 1 hour after feeding, with the system skimmer (H&S A200-1260) off. We arrived at this time point after a little experimentation. We had examined TOC levels in this system over the course of a week’s time (Feldman, 2008c), and those data indicated that there was a spike in TOC values a few hours after feeding, but that the TOC levels returned to baseline after about 24 hours or so. The system’s skimmer was turned off for ~ 1-2 hours after feeding but otherwise was operational. These observations prompted an initial decision to remove tank water 24 hours after feeding to minimize the possibility of contamination by food residue. In addition, we anticipated that once we removed the tank water from the TOC-producing corals, then little additional TOC would be added to the water and so the test skimmer would simply deplete the 30-gallon water sample of existing TOC over time. Data from this first run using the Euroreef CS80 skimmer are shown in Fig 10. It is clear that our expectation was not met. In fact, the TOC levels did not change much beyond random scatter in the data. The Euroreef CS80 skimmer did not do anything! We surmised that the problem lay in the fact that the aquarium water already had been depleted of its “removable” TOC by both the H&S skimmer and by bacterial consumption (Ferrier-Pagès, 1998; Ferrier-Pagès, 2000; Kuntz, 2005; Kline, 2006; Feldman, 2008c) over the 24-hr post-feeding period. Thus, apparently there was almost nothing left for the Euroreef skimmer to remove. To avoid this problem, the aquarium water removal time had to be changed, and after some experimentation, we determined that water removal at 1 hour ± 15 min after feeding (H&S skimmer off during this time) provided a sample of water that was amenable to TOC removal via skimming. Justification for this choice can be found in Figs. 5 and 6 of Feldman, 2008c. By simple observation, there was no evidence for particulate matter in the aquarium water at that point in time; the visible food had been consumed long before. Is this a legitimate procedure for assaying aquarium water? We argue that in the normal course of tank husbandry, an aquarist would, of course, feed the tank (skimmer on or off) and then at some point would rely on the skimmer to remove “excess” TOC from the water. That excess TOC might be food residue directly, but also it would likely contain components originating from the consequences of food addition; fish poop and coral mucus. It is just this uncharacterized mixture that we are assaying when we remove aquarium water at the 1-hour mark, and so we suggest that our skimmer tests do probe the issue of aquarium water purification under realistic conditions.
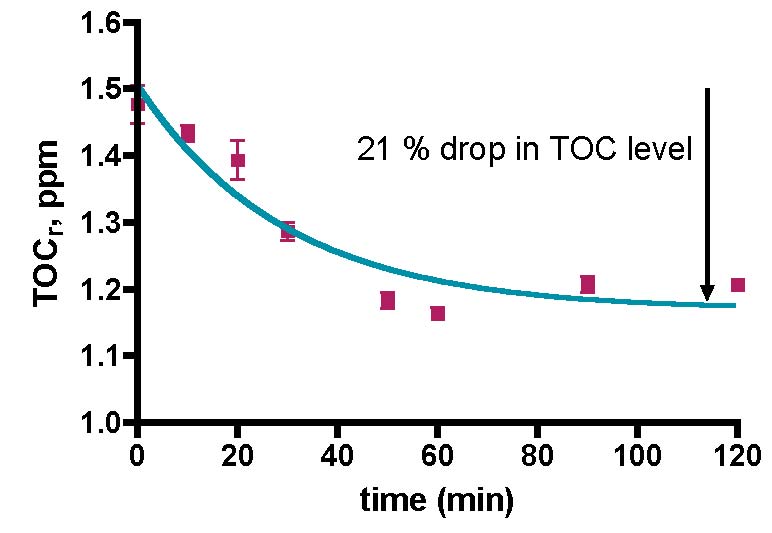
Figure 11. A second attempt to measure TOC depletion in authentic aquarium water using the Euroreef CS80 skimmer. The water sample was removed from the aquarium 1 hour after feeding. The green line is the best fit using Eq. (21).
The implementation of the 1-hour-after-feeding water removal protocol with the Euroreef CS80 skimmer led to more favorable results, Fig. 11. The data points (in purple) can be fit by Eq. (21) (in green) fairly well; r2 = 0.86. The TOC removal profile using the Euroreef CS80 skimmer (Fig. 11) is slightly different than the profile obtained from BSA removal from aquarium water (Fig. 8; r2 = 0.97). These differences reside largely at the longer time data points, and they will impact the mathematical analysis, as described below.
The data points (purple) of Fig. 11 can be utilized as input for Eq. (20) with Q = 2.5 gpm, Vs = 0.62 gallons and Vr = 30 gallons. The derived plot of -Ln([TOC]r/[TOC]0) vs. t is illustrated in Fig. 12. According to our mathematical modeling, this graph should be linear just as it was in the BSA data analysis (see Fig. 9). Clearly it is not. What went wrong? A closer examination of the data in Fig. 12 reveals that, in fact, a very well defined straight line can be drawn through the 0 – 50 min data range (r2 = 0.91). If we confine our analysis to this region of the graph, then using Eq. (20) permits calculation of the rate constant, k, based on the straight line indicated in blue on Fig. 12; k = 0.26 min-1. What about the discarded data at 60 – 120 min of Fig. 12? Is it legitimate to ignore these values? In this case yes; the skimmer pulls out all of the TOC that it is going to remove by the 50-minute mark. Beyond that time point, nothing much is happening and the TOC level doesn’t change much. This leveling of the TOC value probably accounts for the r2 value of less than 0.9 for the exponential decay curve fit in Fig 11, as the lack of TOC removal after 50 min is not consistent with one of the tenets of the mathematical model (rate of TOC removal is proportional to the amount of TOC present). Nevertheless, the fit is not too bad, and that correspondence allows us to arrive at an amount of TOC depletion for this run of ~ 21% (see Fig. 11). The derived k value, 0.26 min-1, is directly comparable to the k value for BSA removal with this skimmer (0.87 min-1), and it is apparent that the Euroreef CS80 is approximately 3.3 times better (faster) at removing BSA than it is at removing TOC.

Figure 12. Mathematical treatment of the data in Fig. 12 using Eq. (20) with Q = 2.9 gpm, Vs = 0.62 gallons, and Vr = 30 gallons.
This procedure was repeated for the Euroreef CS80 skimmer five more times, and the accumulated data are displayed in Table 3. Every attempt was made to keep the water flow rate Q constant between the runs; the measured flow values are given as well. The average figures of merit for these six independent runs are: rate constant k = 0.24 ± 0.07 min-1 and amount of TOC depletion = 20 ± 5%. Similar TOC removal experiments were performed for the other three skimmers illustrated in Fig. 7. These data are tallied in Table 3 as well. For the two cases where % TOC removed values are not reported, the data did not fit the exponential decay of Eq. (21) closely enough to get a legitimate plateau value. The collection of r2 values obtained for the various curves span the following ranges: Euroreef CS80 k r2 values: 0.81 – 0.95, % TOC removal r2 values: 0.76 – 0.96; PM ES100 k r2 values: 0.52 – 0.93, % TOC removal r2 values: 0.65 – 0.82; PM AP624 k r2 values: 0.85 – 0.94, % TOC removal r2 values: 0.84 – 0.9; and ETSS evolution 500 k r2 values: 0.67 – 0.93, % TOC removal r2 values: 0.69 – 0.92. The lower end r2 values are indicative of lower quality data, which likely reflects our imperfect attempts to hold all non-varying parameters constant. Some of the data inconsistency also may arise from the inevitable differences that attend unrecognized variability in both the food composition and the fate of that food on any given day during the hour that it is consumed in the aquarium prior to water removal.
| Trial | EuroReef CS80 needlewheel | ETSS Evolution 500 downdraft | ||||
|---|---|---|---|---|---|---|
| k min-1 | % TOC removed | Flow gph | k min-1 | % TOC removed | Flow gph | |
| 1 | 0.26 | 21 | 172 | 0.33 | 38 | 398 |
| 2 | 0.11 | 18 | 168 | 0.16 | 16 | 398 |
| 3 | 0.20 | 30 | 178 | 0.20 | 31 | 350 |
| 4 | 0.23 | 17 | 174 | 0.11 | 16 | 372 |
| 5 | 0.26 | 15 | 174 | 0.11 | 17 | 367 |
| 6 | 0.35 | 19 | 166 | |||
| Ave | 0.24±0.07 | 20±5 | 172±4 | 0.18±0.08 | 24±9 | 377±19 |
| Trial | Precision Marine ES100 venturi | Precision Marine AP624 airstone | ||||
|---|---|---|---|---|---|---|
| k min-1 | % TOC removed | Flow gph | k min-1 | % TOC removed | Flow gph | |
| 1 | 0.14 | 34 | 222 | 0.11 | 23 | 205 |
| 2 | 0.20 | 18 | 215 | 0.16 | 34 | 209 |
| 3 | 0.23 | 27 | 224 | 0.16 | 31 | 216 |
| 4 | 0.15 | — | 228 | 0.17 | 34 | 213 |
| 5 | 0.21 | 21 | 215 | 0.23 | — | 202 |
| 6 | ||||||
| Ave | 0.19±0.03 | 25±11 | 221±5 | 0.17±0.04 | 31±5 | 209±5 |
There is no statistical difference between the k values for the Euroreef CS80, Precision Marine ES100, Precision Marine AP624, and ETSS evolution 500 skimmers; all of the k value data sets fall within the same range. This near equivalency between the rate constants for TOC removal mirrors the same convergence of k values with the model BSA system (Table 1). Thus, there is a welcome consistency between the “real” system, TOC in authentic reef tank water, and the model system, BSA in freshly prepared saltwater, that raises confidence in using the latter as a surrogate for the former.
The %TOC removal data also evinces a very consistent picture of skimmer operation. The rather large scatter in the data as indicated by the error bars (from 16 – 44% of the mean value) does not permit any statistically significant distinction to be made between any two skimmers in their overall capacity to remove TOC. The source of this scatter is likely to be a combination of the approximations used in applying Eq. (21) to determining the % TOC removed, and the seemingly unavoidable fluctuations of the data at longer time points, as discussed earlier. Nevertheless, the data are robust enough to glean general trends. Thus, all skimmers tested remove around 20 – 30% of the TOC in the aquarium water, and that’s it; 70 – 80% of the measurable TOC is left behind unperturbed by the skimming process. It may be possible to develop a rationalization for this unexpected behavior by referring back to Fig. 1. Perhaps only 20 – 30% of the organic species in the aquarium water meet the hydrophobic requirements for bubble capture, whereas the remaining 70-80%, for whatever reason, don’t. Since the chemical structures of the TOC components are not known, any further speculation along these lines must await chemical structural analysis for verification.
One final observation about skimmer performance can be gleaned from these experiments. Skimmer manufacturers often describe a “break-in” period at start-up during which the skimmer does not collect much skimmate but the riser tube gets coated with a biocompatible film (?) that then favors skimmate deposition. In all of the skimmer runs described above, the skimmer was scrupulously cleaned and dried before each use. Thus, each skimmer run proceeded from the equivalent of initial start-up conditions. All skimmers in all runs exhibited TOC depletion in the reservoir water by the 20-minute time point. Fifteen out of the 21 total skimmer runs exhibited marked TOC depletion by the 10-min mark, the earliest time point in the experiments. There did not seem to be any preference amongst the four skimmers; three of the skimmers generated two of the “slow start” runs each. Thus, it appears, based upon these results, that a perfectly clean skimmer will begin to extract organic residue from aquarium water before 20 minutes of operation. For the six skimmer runs that did not display a diminished TOC level at the 10-min mark, the mathematical determination of k excluded the 10-min data point.
Conclusions
Protein skimmers have become indispensable for many aquarists who strive to maintain the high water quality necessary to keep stony corals. This singular piece of equipment is typically the second largest expense after the tank itself, and as of this writing, there are at least 23 different skimmer vendors in operation. The advertising that accompanies these products often boasts of superlative performance, but no skimmer manufacturer has offered any quantitative support for their claims, in part because no useful metric for skimmer performance exists. In this article, we introduce two different measures for skimmer performance; (1) how fast the skimmer removes organic matter from salt water, and (2) how much of the existing organic material actually is removed. We demonstrate how these quantities can be obtained via experimental measurement and mathematical modeling on a model system consisting of Bovine Serum Albumin (BSA) in freshly prepared saltwater. In addition, we demonstrate that the trends among the numerical values obtained in the BSA model system also are observed with TOC removal from authentic aquarium (reef tank) water. The correlation between the BSA model system results and the TOC reef tank water results supports the hypothesis that BSA in saltwater can be used as an effective surrogate for TOC in aquarium water.
Four skimmers having four different reaction chamber volumes and representing four distinct types of bubble generation (needlewheel, venturi, airstone, and downdraft) were tested under the manufacturers’ specified conditions. These tests revealed that there was no demonstrable difference between the Euroreef CS80 needlewheel skimmer, the Precision Marine ES100 venturi skimmer, the Precision Marine AP624 airstone skimmer, and the ETSS evolution 500 downdraft skimmer with respect to the rate constant for either TOC or BSA removal. Thus it is fair to conclude that, at least for the skimmers tested under the specified conditions, the individual manufacturers’ claims of superior performance are without merit. Whether this conclusion can be extended to other skimmers remains to be seen.
Two operational parameters were examined; airflow rate and water flow rate. For the one skimmer tested at different airflow rates (Precision Marine AP624), the rate constant k for BSA removal did increase significantly as air velocity increased. The performance response upon varying water flow rate was not unequivocal. Using the Precision Marine AP624 airstone skimmer as a test system, increasing the water flow rate at first increased, and then decreased, the rate constant k. The basis for these divergent results has not yet been elucidated.
All four skimmers were quite similar in the second performance figure-of-merit, the total amount of organics removed. The skimmers typically removed greater than 80% of the BSA. In contrast, perhaps one of the more interesting observations to emerge from these studies is the fact that all four skimmers tested removed only 20 – 30% of the total organics present in authentic reef tank water.
Several critical questions that cannot yet be answered concern the generality of the conclusions drawn above. Can any skimmer beat the 30% organic removal level, or is that an intrinsic property of the TOC (cf. Fig. 1)? What are the effects of either gas flow rates or water flow rates that are far outside of the examined range, on k? Are there other unrecognized factors buried in the “k” term involved in determining skimmer performance? These questions can only be answered by examining more skimmers under a wider range of conditions.
From a different perspective, the methodology introduced in this article, in particular the BSA model system, presents a real opportunity for skimmer designers/manufacturers actually to optimize skimmer design/operational parameters in a deliberate and rational manner. Through these types of product development studies, skimmer manufacturers finally might be able to include descriptors in their advertising such as “best”, “fastest” etc. that really mean something.
Acknowledgment
We thank the Eberly College of Science at the Pennsylvania State University for financial support, Dr. Bruce Logan and Mr. David Jones of the Pennsylvania State University Department of Civil and Environmental Engineering for use of the Shimadzu 5000 TOC Analyzer, and Dr. James Vrentas of the Pennsylvania State University Department of Chemical Engineering for assistance in developing the mathematical model described in this article.
References
- Aksay, S.; Mazza, G. 2007. “Optimization of Protein Recovery by Foam Separation Using Response Surface Methodology.” J. Food Eng. 79, 598-606.
- Ahmed, S. I. 1975. “Laws of Foam Formation and Foam Fractionation.” Sep. Sci. 10, 673-688.
- Bhattacharjee, S.; Kumar, R.; Gandhi, K. S. 1997. “Prediction of Separation Factor in Foam Separation of Proteins.” Chem. Eng. Sci. 52, 4625-4636.
- Brown, L.; Narsimhan, G.; Wankat, P. C. 1990. “Foam Fractionation of Globular Proteins.” Biotechnol. Bioeng. 36, 947-959.
- Caballero, M.; Cela, R.; Perez-Bustamante, J. A. 1990. “Analytical Applications of Some Flotation Techniques – A Review.” Talanta 37, 275-300.
- Clark, A. N.; Wilson, D. J. 1983. Foam Flotation: Theory and Applications. Marcel Dekker, Inc. New York.
- Du, L.; Loha, V.; Tanner, R. D. 2000. “Modeling a Protein Foam Fractionation Process.” Appl. Biochem. Biotechnol. 84-86, 1087-1099.
- Du, L.; Ding, Y.; Prokop, A.; Tanner, R. D. 2001. “Measurement of Bubble Size Distribution in Protein Foam Fractionation Column Capillary Probe with Photoelectric Sensors.” Appl. Biochem. Biotechnol. 91-93, 387-404.
- Du, L.; Prokop, A.; Tanner, R. D. 2002. “Effect of Bubble Size on Foam Fractionation of Ovalbumin.” Appl. Biochem. Biotechnol. 98-100, 1075-1091.
- Du, L.; Prokop, A.; Tanner, R. D. 2003. “Variation of Bubble Size Distribution in a Protein Foam Fractionation Column Measured Using a Capillary Probe with Photoelectric Sensors.” J. Colloid Interface Sci. 259, 180-185.
- Felder, R. M.; Rousseau, R. W. 2005. Elementary Principles of Chemical Processes, 3rd Ed., John Wiley and Sons, New York.
- Feldman, K. S.; Vernese, L. F.; Mueller, K. T.; Maers, K. 2008a. “Granular Activated Carbon: Modeling of Operational Parameters for Dissolved Organic Carbon Removal from Marine Aquaria, Part 1.” Advanced Aquarist, 7, http://www.advancedaquarist.com/2008/1/aafeature1/.
- Feldman, K. S.; Vernese, L. F.; Mueller, K. T.; Maers, K. 2008b. “Granular Activated Carbon: Modeling of Operational Parameters for Dissolved Organic Carbon Removal from Marine Aquaria, Part 2.” Advanced Aquarist, 7, http://www.advancedaquarist.com/2008/2/aafeature1/.
- Feldman, K. S.; Maers, K. M. 2008c. “”Total Organic Carbon (TOC) and the Reef Aquarium; an Initial Survey. Part 1.” Advanced Aquarist, 7, http://www.advancedaquarist.com/2008/8/aafeature3/.
- Feldman, K. S.; Maers, K. M. 2008d. “Total Organic Carbon (TOC) and the Reef Aquarium; an Initial Survey. Part 2.” Advanced Aquarist, 7, http://www.advancedaquarist.com/2008/9/aafeature2/.
- Ferrier-Pagès, C.; Gattuso, J.-P.; Cauwet, G.; Jaubert, J.; Allemand, D. 1998. “”Release of Dissolved Organic Carbon and Nitrogen by the Zooxanthellate Coral Galaxea fascicularis.” Mar. Ecol. Prog. Ser., 172, 265-274.
- Ferrier-Pagès, C.; Leclercq, N.; Jaubert, J.; Pelegri, S. P. 2000. “Enhancement of Pico- and nanoplankton Growth by Coral Exudates.” Aquat. Microb. Ecol., 21, 203-209.
- Gehle, R. D.; Schügerl, K. 1894. “Protein Recovery by Continuous Flotation.” Appl. Microbiol. Biotechnol. 20, 133-138.
- Holmes-Farley, R. 2006. “What is Skimming?” Reefkeeping, 5, http://www.reefkeeping.com/issues/2006-08/rhf/index.php.
- Kuntz, N. M.; Kline, D. I.; Sandin, S. A.; Rohwer, F. 2005. “”Pathologies and Mortality Rates Caused by Organic Carbon and Nutrient Stressors in Three Caribbean Coral Species.” Mar. Ecol. Prog. Ser., 294, 173-180.
- Huckstedt, G. 1972. “Foam Flotation Separation System Particularly Suitable for Separating Dissolved Protein Compounds and Toxic Metallic Ions from Aquarium Water.” US Patn. 3,669,883.
- Kline, D. I.; Kuntz, N. M.; Breitbart, M.; Knowlton, N.; Rohwer, F. 2006. “”Role of Elevated Organic Carbon Levels and Microbial Activity in Coral Mortality. Mar. Ecol. Prog. Ser., 314, 119-125.
- Lemlich, R., Ed. 1972. Adsorptive Bubble Separation Techniques. Academic Press, New York.
- Lockwood, C. E.; Bummer, P. M.; Jay, M. 1997. “Purification of Proteins Using Foam Fractionation.” Pharm. Res. 14, 1511-1515.
- Okamoto, Y.; Chou, E. J. 1979. “Foam Separation Processes” in Handbook of Separation Techniques for Chemical Engineers, Schweitzer, P. A., Ed. Wiley, New York.
- Ostwald, W.; Siehr, A. 1937. “Analysis of Foams and Solution by Foaming.” Chem. Ztg. 61, 649-660.
- Rosa, P. T. V.; Santana, C. C.; Carbonell, R. G. 2007. “Determination of the Liquid Pool Surfactant and Protein Concentration for Semi-Batch Foam Fractionation Columns.” Brazilian J. Chem. Eng. 24, 1-14.
- Thiel, A. J. 1997. “Trends in Foam Fractionation.” http://www.netpets.com/fish/reference/saltref/foam.html.
- Schnepf, R. W.; Gaden, E. L. 1959. “Foam Fractionation of Proteins: Concentration of Aqueous Solutions of BSA.” J. Biochem. Microbiol. Technol. Eng. 1, 1-11.
- Schutz, F. 1937. “Adsorption on Foams.” Nature 139, 629-630.
- Suzuki, Y.; Hanagasaki, N.; Furukawa, T.; Yoshida, T. 2008. “Removal of Bacteria from Coastal Seawater by Foam Separation Using Dispersed Bubbles and Surface-Active Substances.” J. Biosci. Bioeng. 105, 383-388.
- Uraizee, F.; Narsimhan, G. 1995. “A Model for Continuous Foam Concentration of Proteins: Effects of Kinetics of Absorption of Proteins and Coalescence of Foam.” Sep. Sci. Technol. 30, 847-881.
- Uraizee, F.; Narsimhan, G. 1996. “”Effects of Kinetics of Adsorption and Coalescence on Continuous Foam Concentration of Proteins: Comparison of Experimental Results with Model Predictions.” Biotech. Bioeng. 51, 384-398.
- Wallace, G. T., Jr.; Wilson, D. F. 1969. “Foam Separation as a Tool in Chemical Oceanography.” Naval Research Laboratory, Accession number: AD 0697924.
- Wong, C. H.; Hossain, M. M.; Davies, C. E. 2001. “Performance of a Continuous Foam Separation Column as a Function of Process Variables.” Bioprosess Biosys. Eng. 24, 73-81.

0 Comments